Theremino MCA To do : Thing I 'd like to see
- Calculation of expected spectrum:
Actual spectrum of Cs-137
I think we can calculate and obtain approximately same curve from photo peak energy, efficiency curve, crystal size, FWHM (at various energy), the information regarding to shielding (if any), and the geometry/distance/density/mass of sample to be measured.
From these info, we can calculate photo peak, Compton scatter, single/double escape and annihilation/sum peaks (if applicable), and X-ray from fluorescence.
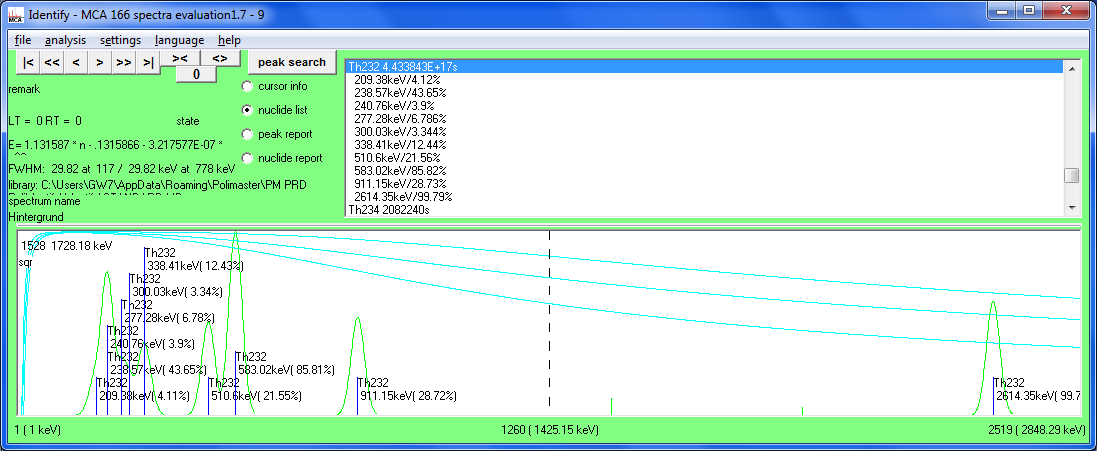
- Example of calculated spectrum (Photo peaks only) of Ra226 and Th232(with their daughters)


- Add Compton scatter --- We have Nishina Klein formula
- Compton edge rounding
- Compton valley rise --- Depending on crystal size
- Add single and double escape
- Add sum peak(s) and its scatter
- Add annihilation peak --- 511KeV
- Add back scatter and Pb X-ray
In other words, incorporating very simplified version of nucleonica Gamma Spectrum Generator to facilitate learning and isotope identification, as well as guessing detector characteristics.
http://www.nucleonica.com/wiki/index.php?title=Help%3AGamma_Spectrum_Generator%2B%2B
- When we can do this for single and multi-peak isotopes, we can construct emulated background and expected measurement result of a sample with known isotopes, by adding common (and usually known) natural isotopes such as K40, Ra226, Th232, etc.
- Then, we can compare calculated result against actual result to estimate detector characteristics.
- With all these, we can detect and measure sample containing unknown isotope(s) with more confidence.
- Visualizing expected peaks will help newbies to learn about spectroscopy with more fun!
- It will reduce the chance of error for mistaking an isotope for another one.
- Peak detection
- First, smooth data considering the FWHM info
- Detect peak considering the FWHM info and efficiency info, etc
- Guessing isotopes
- Auto ROI setting
- Depending on expected isotope(s), if any, and detected peaks, set ROI to be used for peak fitting and Covell method.
- Isotope guessing
- From the detected peaks and their height, guess isotope(s) (and peaks) to be used for fitting, etc.
- Peak fit Peak Fit With Gnuplot
- Fit and re-evaluate isotope list if necessary
- Backed by Covell method, as well
- Check the result of peak fitting against Covell method
- 3D spectrum (From the catalog of Seiko EG&G Spectrum Navigator http://www.sii.co.jp/jp/segg/files/2013/03/file_PRODUCT_MASTER_1653_GRAPHIC02.pdf )

Please let me know of features you want to see ==> nkom AT pico.dreamhosters.com