應掕婍偲壏搙曄壔 Temperature And Probes
壏搙偺娗棟偑埨掕偟偨應掕偵偼廳梫偱偁傞偙偲偼丄奆條偛懚抦偐偲巚偄傑偡偑丄壏搙偺曄壔偑偛棙梡偺應掕婍偵偳偺條側塭嬁傪媦傏偡偺偐丄
幚嵺偵帋偝傟偨曽傕偄傜偭偟傖傞偱偟傚偆丅
巹傕丄俶倎俬偺侾丏俆僀儞僠偺應掕婍傪忢壏丄偦偟偰椻憼屔偺拞丄偝傜偵椻搥屔偺拞傊偲擖傟偰傒偰丄壏搙偺曄壔偱偳傫側堘偄偑弌傞偺偐挷傋偰傒傑偟偨丅
巊梡偟偨應掕婍偼丄儘僔傾惢偺 Sovtube Detector 俶倎俬侾丏俆僀儞僠偱丄係枩墌偐俆枩墌掱搙偱僆乕僋僔儑儞偱攦偭偨傕偺偱偡丅
應掕婍偼丄岤偝係倣倣傎偳偺墧偺僷僀僾偵乮娙堈幷暳乯偵擖傟丄偦偺拞偵偼丄帴婥幷暳梡偺僷乕儅儘僀偺斅傕巇崬傫偱偁傝傑偡丅
壏搙寁偺僾儘乕僽偼丄應掕婍偵僥乕僾偱揬傝晅偗丄摦偐側偄傛偆偵偟傑偟偨丅傑偨丄應掕婍偑夞揮偡傞偲丄帴婥幷暳偼偟偰偁偭偰傕
塭嬁傪庴偗傞偐傕偟傟側偄偺偱丄倀俽俛僐僱僋僞乕偑忋懁偵棃傞傛偆偵曐偪傑偟偨丅
偝傜偵偼丄椻憼屔偵偔偭偮偄偰偄傞帴愇偺椶偼丄慡晹墦偔傊摦偐偟傑偟偨丅
Out of curiosity, I decided to check the effects of temperature change on NaI detector.
I used 1.5 inch NaI detector made and sold by Sovtube (See Sovtube Detector).
I used a lead pipe of 4mm thickness as a casual shield against BG, and placed Mu-metal in it, as well.
Then, I taped the temperature sensor on the detector.
傑偢偼丄傎傏忢壏乮偨偩偟丄儊乕僾儖僔儘僢僾偺奃壔嶌嬈傪偟偰偄偨娭學偱丄戜強偼俀俇亷偔傜偄偱偟偨乯偱丄抔婥塣揮傪偟偨屻丄
俀倗偺俠倱侾俁俈墭愼搚忞乮憤慄検偑俀俇俇俛倯偔傜偄乯傪棙梡偟偰峑惓偟丄偦偺傑傑俆暘偛偲偵婰榐傪巒傔傑偡丅
僺乕僋偺埵抲偼丄僥儗儈僲俵俠俙偺帺摦俥倂俫俵梡側偺偱丄昁偢偟傕僺乕僋偺拞怱偱偼偁傝傑偣傫偺偱丄僗儁僋僩儖偺宍側偳傪尒偨曽偑惓妋偱偡丅
偁傞偄偼丄僗儁僋僩儖僼傽僀儖傕偁傝傑偡偺偱丄俽俹俤僼傽僀儖傪懠偺僜僼僩側偳偱撉傒崬傫偱斾傋偨傝偟偰傒偰偔偩偝偄丅
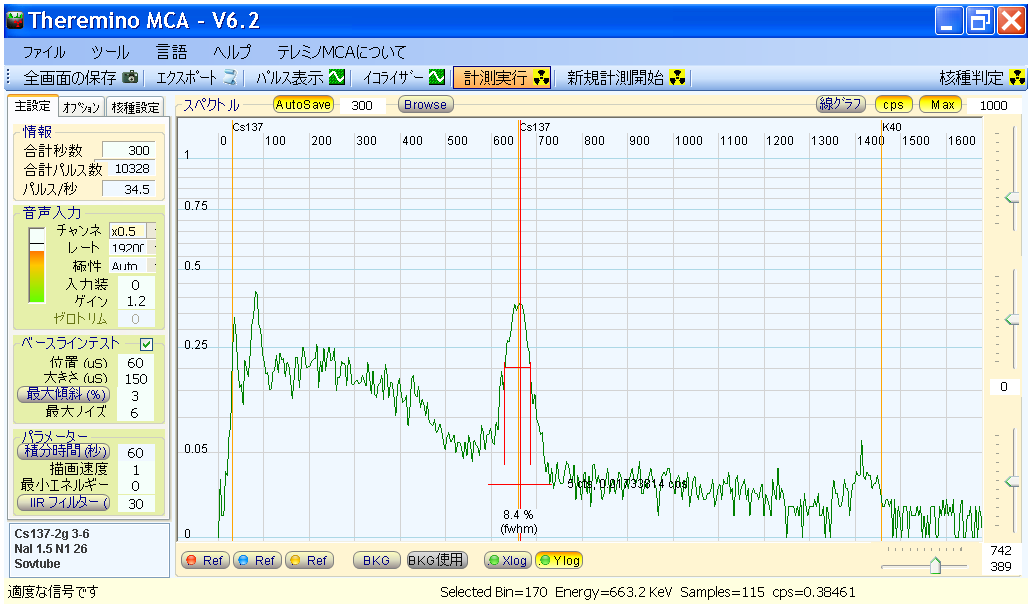
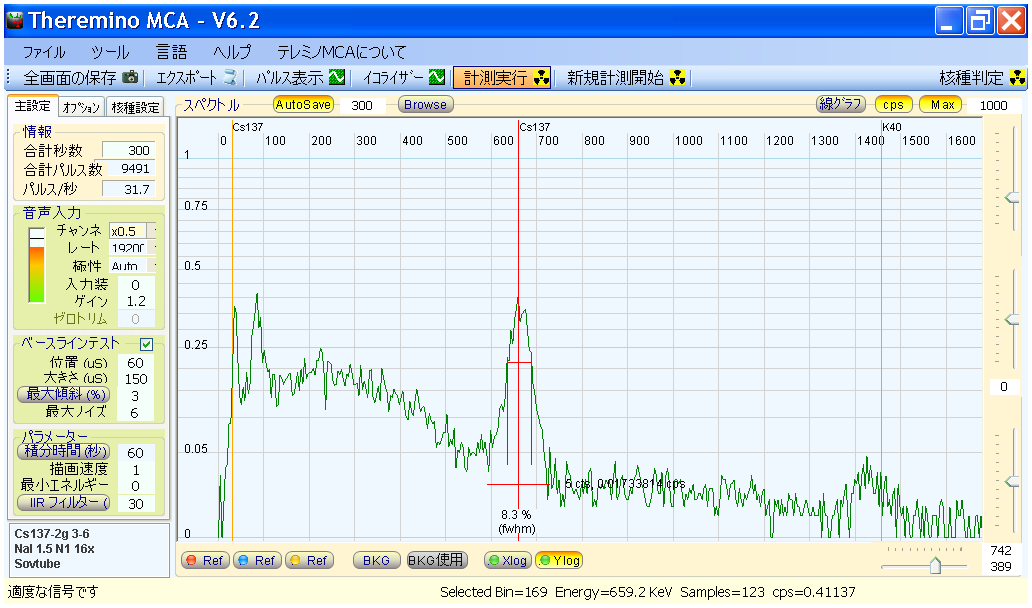
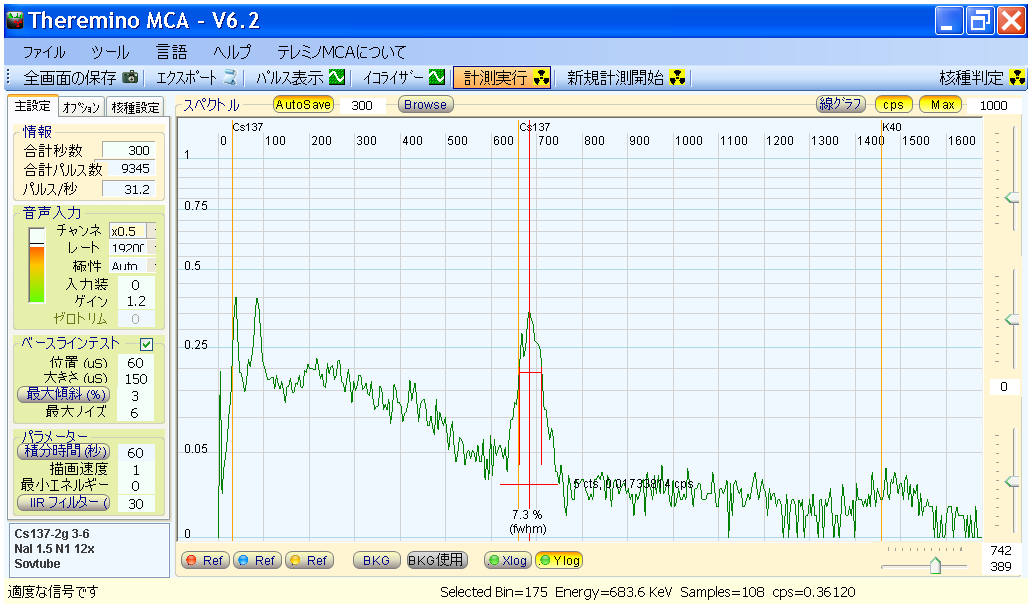
I started from the room temperature.
The peak position and the FWHM aren't very accurate as the measurement time isn't long enough.
俀俇亷
幒壏偺娫偼丄俁俀俲倕倁偺僺乕僋偼丄戝懱侽丏俀俆偐傜侽丏俁們倫倱偔傜偄丅丂師偺墧偺倃慄傜偟偒僺乕僋偼丄侽丏係偐傜侽丏俆偺娫偱摦偒傑偟偨丅
俠倱侾俁俈偺俇俇俀俲倕倁偼丄偩偄偨偄侽丏係們倫倱偔傜偄偱偟偨丅
http://pico.dreamhosters.com/img/V60/2013_12_10_07_56_43-Cs137-2g_3-6-NaI_1.5_N1_26.spe
http://pico.dreamhosters.com/img/V60/2013_12_10_07_56_43-Cs137-2g_3-6-NaI_1.5_N1_26.txt
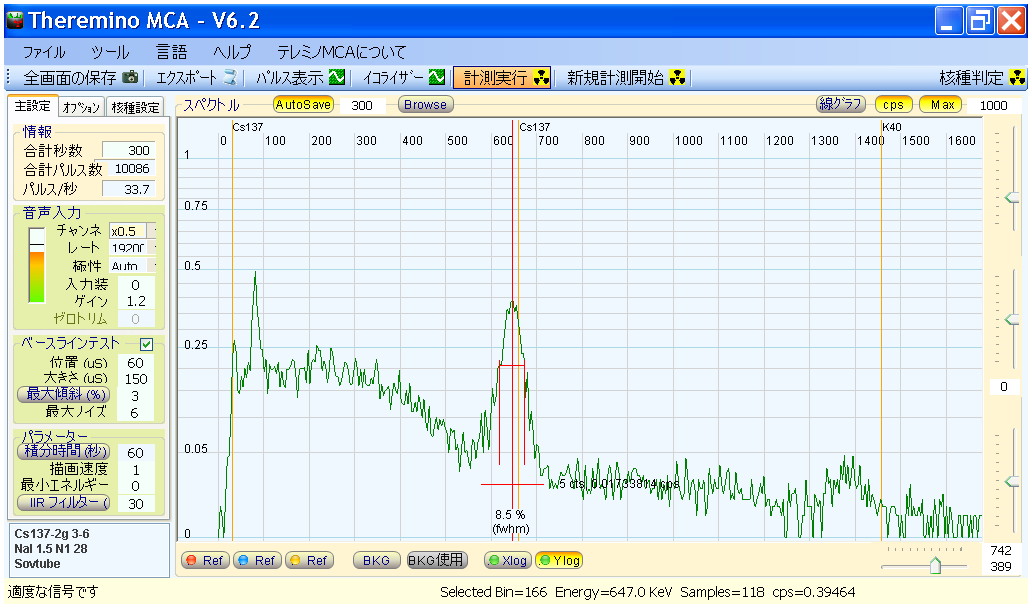
俀俉亷
幒壏偱偺婰榐拞偵丄奃壔嶌愴偺塭嬁偱俀搙傎偳壏搙偑忋偑傝丄偦偺偣偄偱僺乕僋偑彮偟嵍傊僘儗偨條偱偡丅
http://pico.dreamhosters.com/img/V60/2013_12_10_09_21_43-Cs137-2g_3-6-NaI_1.5_N1_28.spe
http://pico.dreamhosters.com/img/V60/2013_12_10_09_21_43-Cs137-2g_3-6-NaI_1.5_N1_28.txt
椻憼屔偵堏摦奐巒
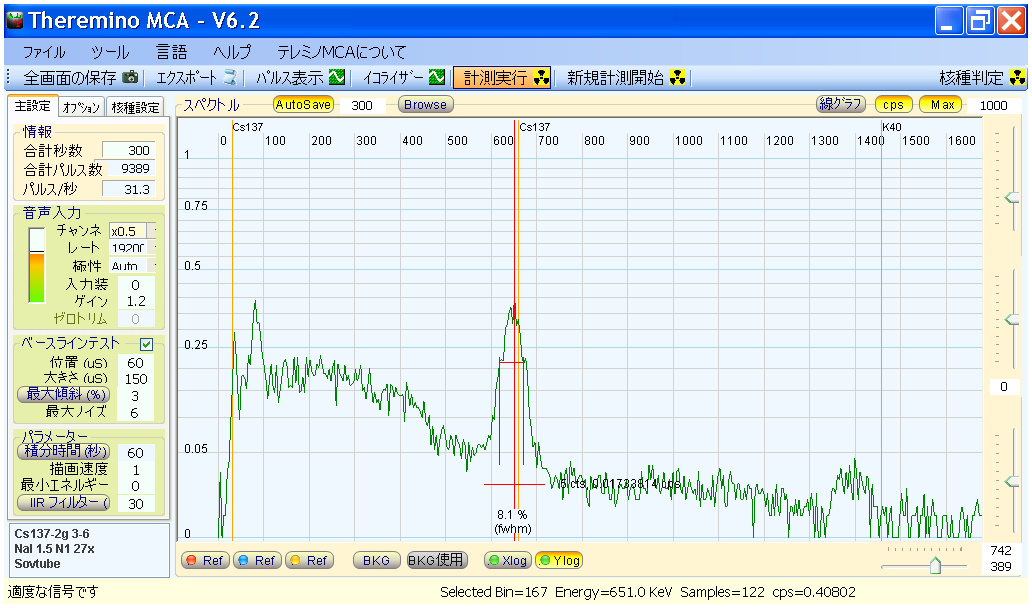
俀俈亷
http://pico.dreamhosters.com/img/V60/2013_12_10_09_56_43-Cs137-2g_3-6-NaI_1.5_N1_27x.spe
http://pico.dreamhosters.com/img/V60/2013_12_10_09_56_43-Cs137-2g_3-6-NaI_1.5_N1_27x.txt
俀侾亷

http://pico.dreamhosters.com/img/V60/2013_12_10_10_01_43-Cs137-2g_3-6-NaI_1.5_N1_21x.spe
http://pico.dreamhosters.com/img/V60/2013_12_10_10_01_43-Cs137-2g_3-6-NaI_1.5_N1_21x.txt
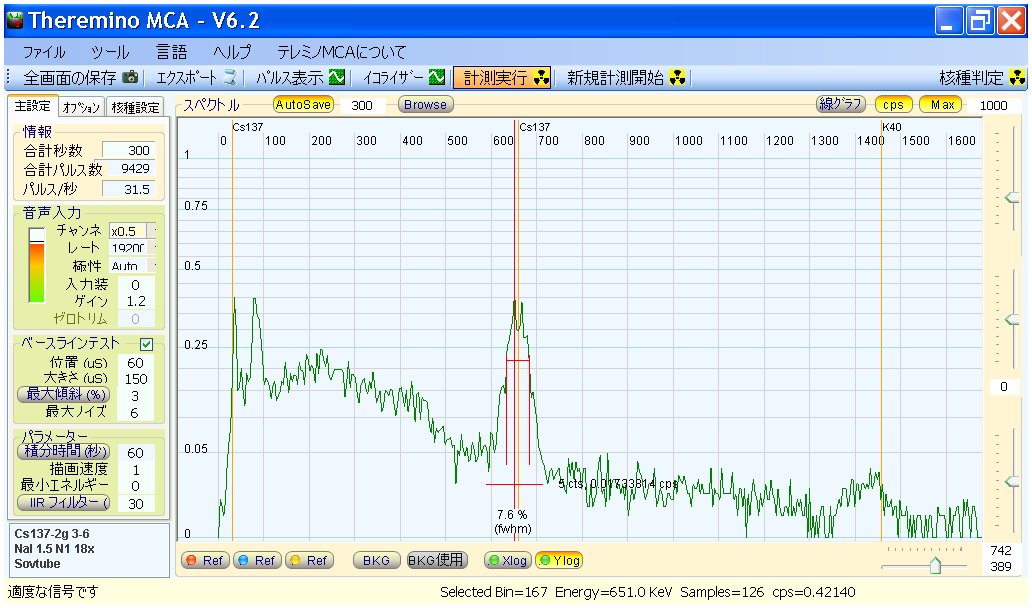
侾俉亷
http://pico.dreamhosters.com/img/V60/2013_12_10_10_06_43-Cs137-2g_3-6-NaI_1.5_N1_18x.spe
http://pico.dreamhosters.com/img/V60/2013_12_10_10_06_43-Cs137-2g_3-6-NaI_1.5_N1_18x.txt
侾俇亷
http://pico.dreamhosters.com/img/V60/2013_12_10_10_11_43-Cs137-2g_3-6-NaI_1.5_N1_16x.spe
http://pico.dreamhosters.com/img/V60/2013_12_10_10_11_43-Cs137-2g_3-6-NaI_1.5_N1_16x.txt
侾係亷
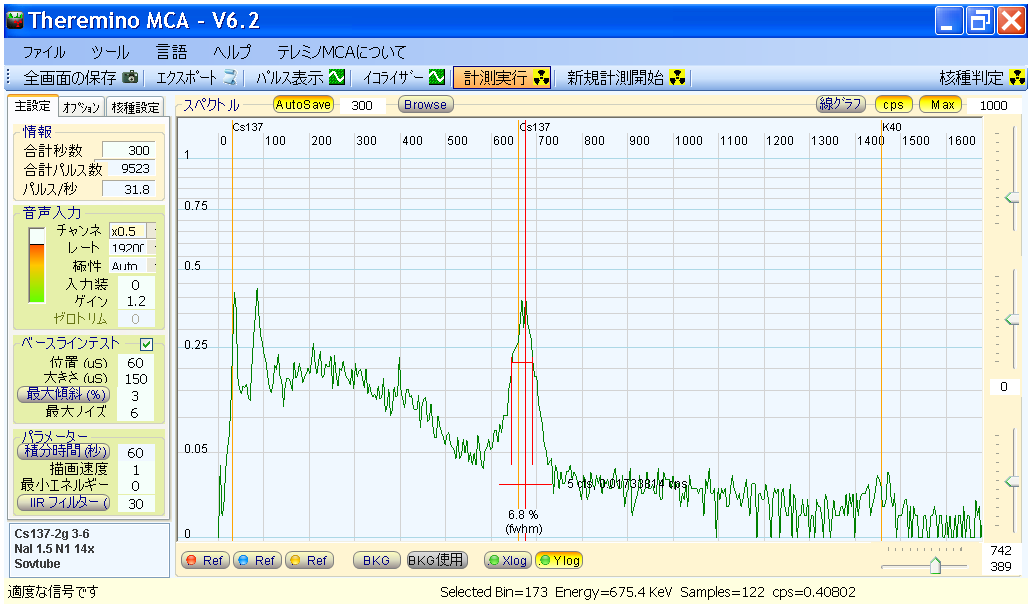
http://pico.dreamhosters.com/img/V60/2013_12_10_10_16_43-Cs137-2g_3-6-NaI_1.5_N1_14x.spe
http://pico.dreamhosters.com/img/V60/2013_12_10_10_16_43-Cs137-2g_3-6-NaI_1.5_N1_14x.txt
侾係亷
http://pico.dreamhosters.com/img/V60/2013_12_10_10_21_43-Cs137-2g_3-6-NaI_1.5_N1_14x.spe
http://pico.dreamhosters.com/img/V60/2013_12_10_10_21_43-Cs137-2g_3-6-NaI_1.5_N1_14x.txt
侾俀亷
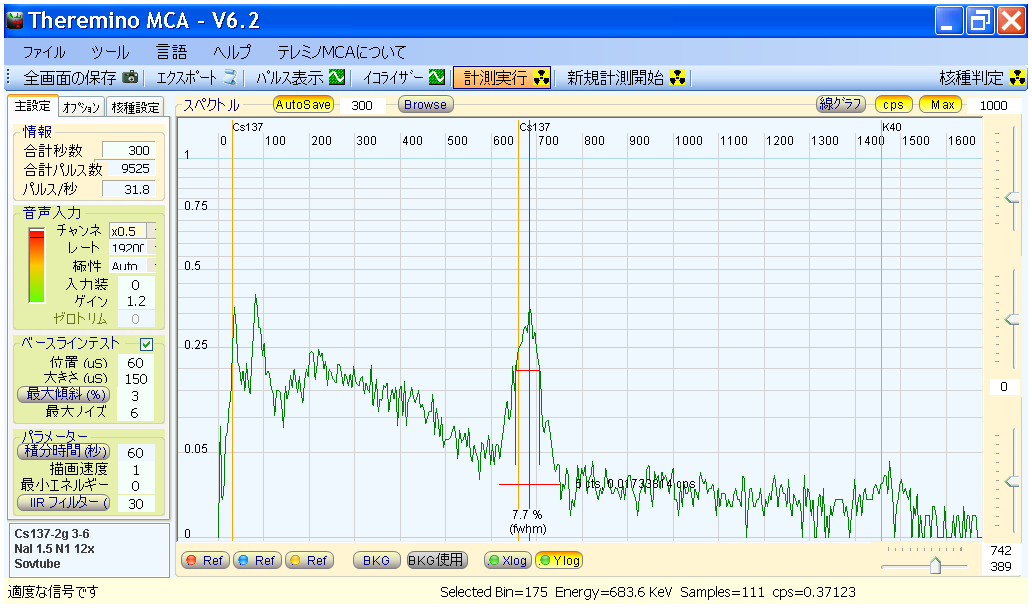
http://pico.dreamhosters.com/img/V60/2013_12_10_10_26_43-Cs137-2g_3-6-NaI_1.5_N1_12x.spe
http://pico.dreamhosters.com/img/V60/2013_12_10_10_26_43-Cs137-2g_3-6-NaI_1.5_N1_12x.txt
侾俀亷
http://pico.dreamhosters.com/img/V60/2013_12_10_10_31_43-Cs137-2g_3-6-NaI_1.5_N1_12x.spe
http://pico.dreamhosters.com/img/V60/2013_12_10_10_31_43-Cs137-2g_3-6-NaI_1.5_N1_12x.txt
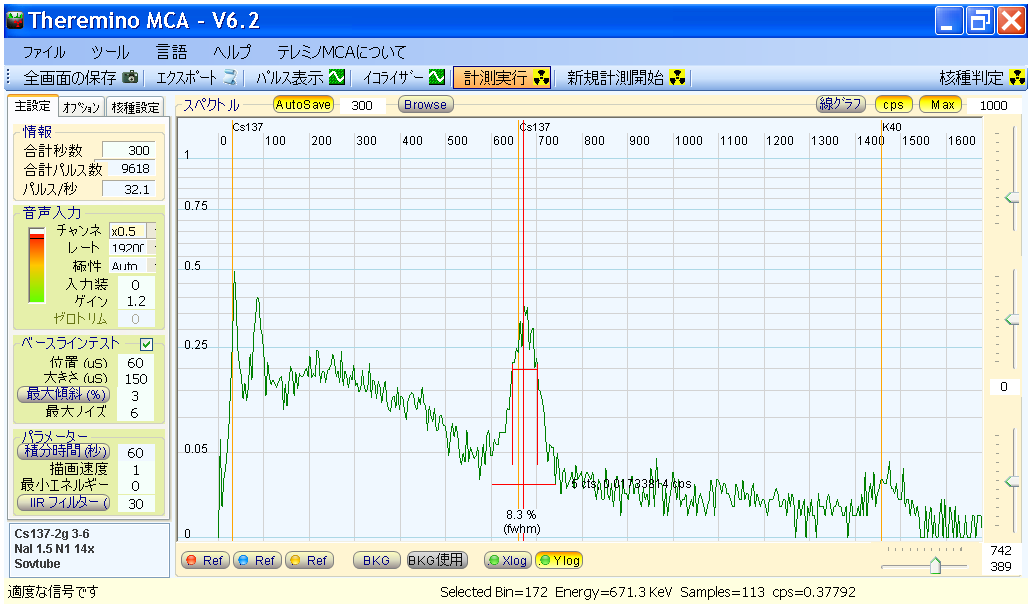
俋亷

http://pico.dreamhosters.com/img/V60/2013_12_10_10_36_43-Cs137-2g_3-6-NaI_1.5_N1_9x.spe
http://pico.dreamhosters.com/img/V60/2013_12_10_10_36_43-Cs137-2g_3-6-NaI_1.5_N1_9x.txt
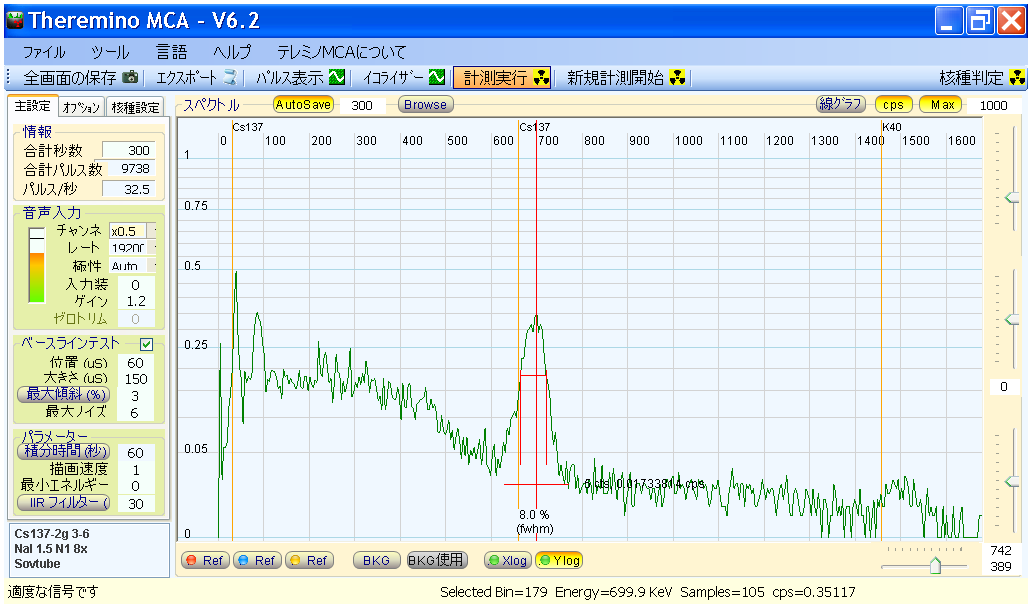
俉亷
http://pico.dreamhosters.com/img/V60/2013_12_10_10_41_43-Cs137-2g_3-6-NaI_1.5_N1_8x.spe
http://pico.dreamhosters.com/img/V60/2013_12_10_10_41_43-Cs137-2g_3-6-NaI_1.5_N1_8x.txt
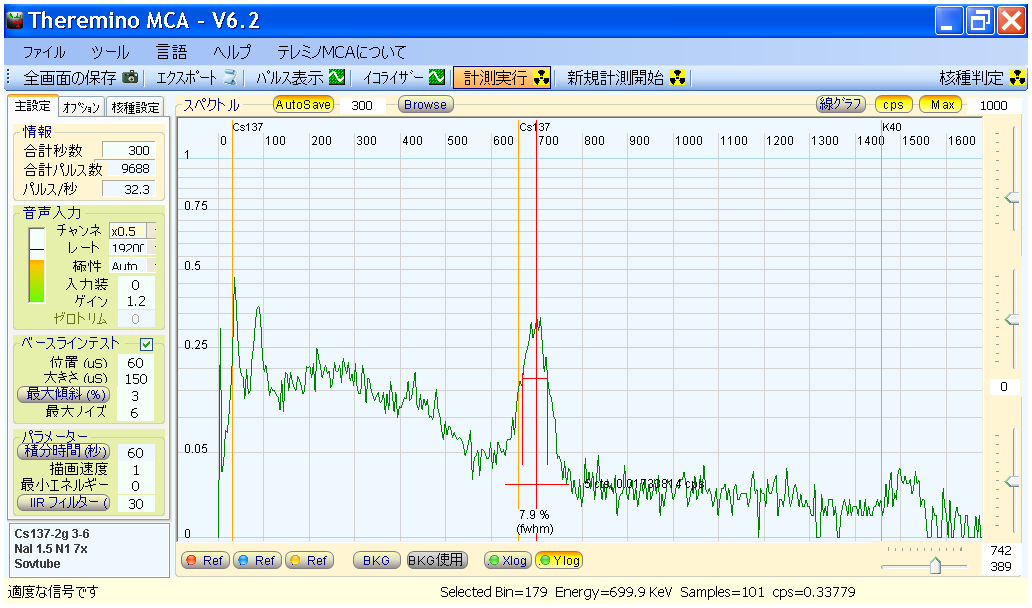
俈亷
http://pico.dreamhosters.com/img/V60/2013_12_10_10_46_43-Cs137-2g_3-6-NaI_1.5_N1_7x.spe
http://pico.dreamhosters.com/img/V60/2013_12_10_10_46_43-Cs137-2g_3-6-NaI_1.5_N1_7x.txt
俈亷
http://pico.dreamhosters.com/img/V60/2013_12_10_10_51_43-Cs137-2g_3-6-NaI_1.5_N1_7x.spe
http://pico.dreamhosters.com/img/V60/2013_12_10_10_51_43-Cs137-2g_3-6-NaI_1.5_N1_7x.txt
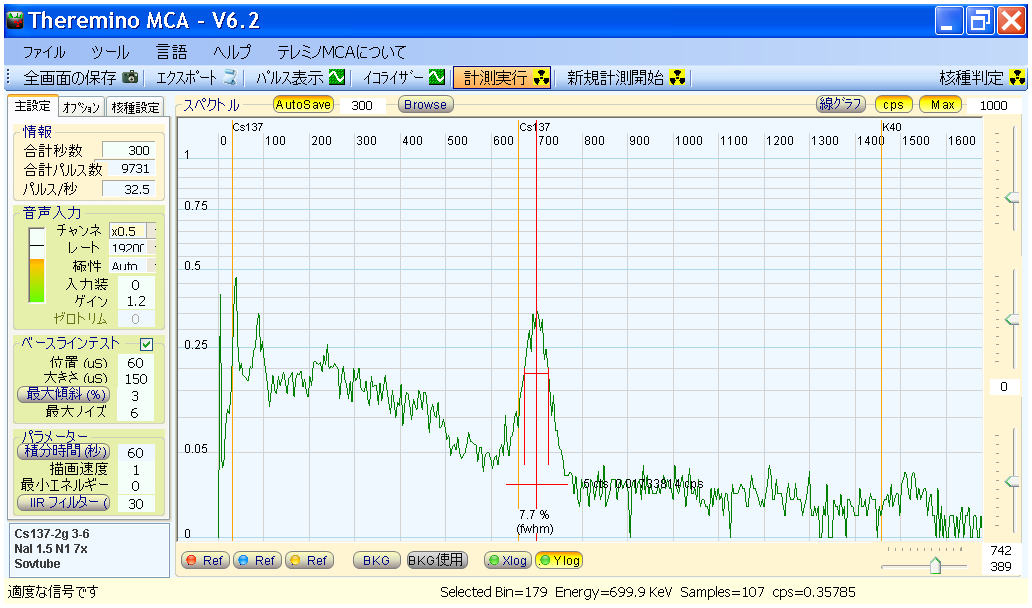
俇亷
http://pico.dreamhosters.com/img/V60/2013_12_10_10_56_43-Cs137-2g_3-6-NaI_1.5_N1_6x.spe
http://pico.dreamhosters.com/img/V60/2013_12_10_10_56_43-Cs137-2g_3-6-NaI_1.5_N1_6x.txt
俇亷
http://pico.dreamhosters.com/img/V60/2013_12_10_11_01_43-Cs137-2g_3-6-NaI_1.5_N1_6x.spe
http://pico.dreamhosters.com/img/V60/2013_12_10_11_01_43-Cs137-2g_3-6-NaI_1.5_N1_6x.txt
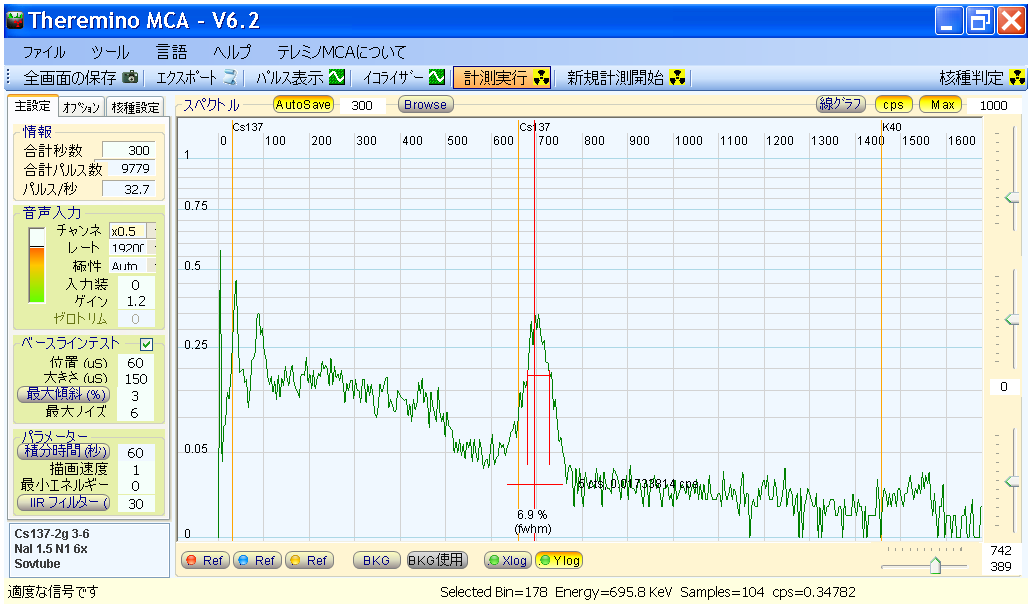
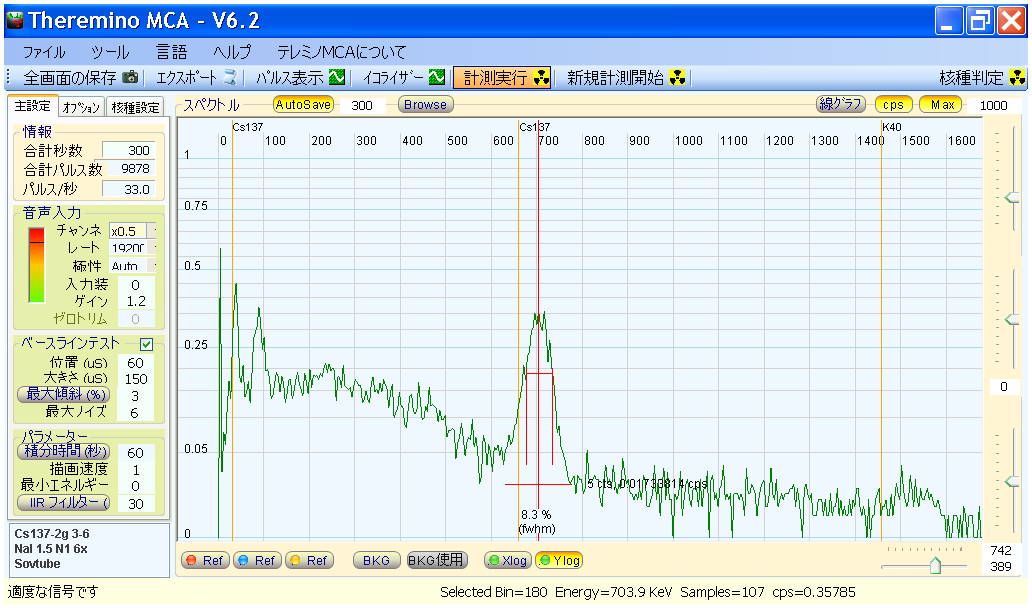
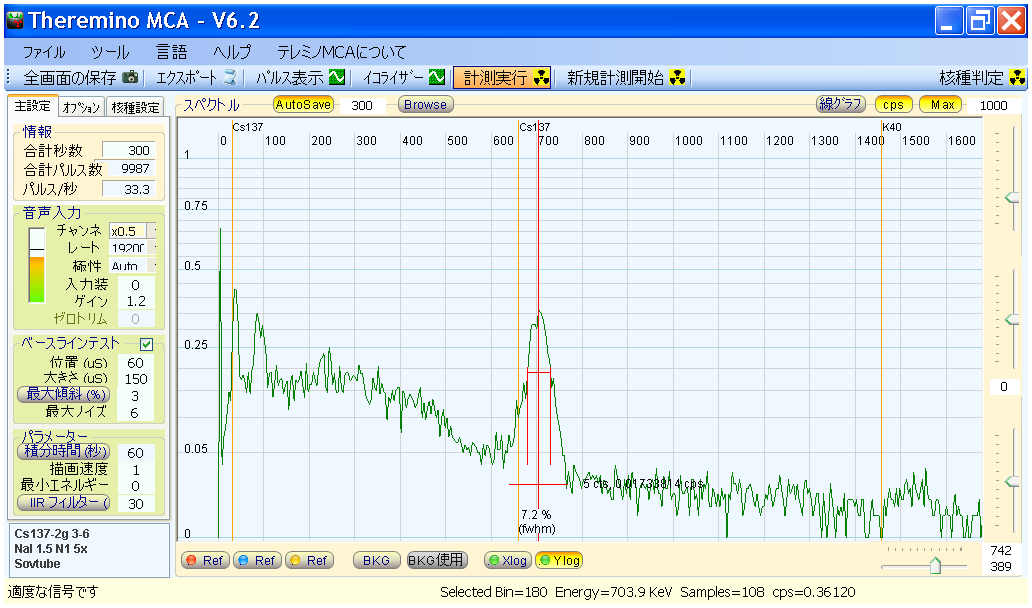
俆亷
椻憼屔偺壏搙偵傎傏掅壓姰椆丅偨偩偟丄椻憼屔偺拞偺壏搙偼丄帪乆俁丏俉亷偲俆丏俉亷偔傜偄偺娫偱梙傟偰偄傑偟偨丅
偙偺條偵丄壏搙偺掅壓偲偲傕偵丄僺乕僋偑塃傊僘儗丄傑偨丄堦斣掅偄曽偺僲僀僘偐杮暔偺僷儖僗偑挊偟偔憹壛偟丄
俁俀俲倕倁偺僺乕僋傕丄墧偺倃慄傛傝傕崅偔側傝傑偟偨丅
偦偺戙傢傝丄俀侽侽俲倕倁傪拞怱偲偡傞媢偼丄壏搙偑掅壓偡傞偲丄庒姳掅偔側傝傑偟偨丅
墧偺倃慄偲俠倱侾俁俈偺俇俇俀俲倕倁偺僺乕僋傕庒姳掅偔側傝傑偟偨丅
暘夝擻偵偮偄偰偼丄俆暘傎偳偺應掕偱偼丄掕偐側偙偲偼丄傢偐傝傑偣傫丅
The peak seems to move to the right into higher energy as the temperature drops.
The 32KeV peak became higher, too.
The plateau from Compton scatter seems to be lower.
Can't say anything about the effect on FWHM, as I didn't measure long enough.
http://pico.dreamhosters.com/img/V60/2013_12_10_11_06_43-Cs137-2g_3-6-NaI_1.5_N1_5x.spe
http://pico.dreamhosters.com/img/V60/2013_12_10_11_06_43-Cs137-2g_3-6-NaI_1.5_N1_5x.txt
愝掕傗幚尡曽朄傪曄偊偰嵞應掕 Another trial with better configuration
忋婰偺嵟弶偺幚尡偑丄偁傫傑傝擺摼偑偄偐側偐偭偨偺偱丄愝掕偲曽朄傪曄偊偰丄嵞應掕偟偰傒傑偟偨丅
曄偊偰揰偼丄傑偢慄尮偲偟偰丄俋侽侽侽俛倯掱搙偺慄検偑偁傞丄僨傿僗僋忬偺昗弨慄尮傪巊梡偟偰丄僺乕僋偑慺憗偔丄偦偟偰偼偭偒傝偲弌傞傛偆偵偟傑偟偨丅
僠儍儞僱儖攞棪傪倶俀偵偟偰丄傕偭偲嵶偐側墶幉偺僘儗偑暘偐傞傛偆偵偟傑偟偨丅
偦偟偰丄帺摦揑曐懚婡擻偺娫妘傪俇侽昩偵偟偰丄偙傟傕傑偨傛傝嵶偐側曄壔傪曔傜偊傞傛偆偵偟傑偟偨丅
屻偼丄僗儉乕僕儞僌傪偐偗偰丄僺乕僋偺崅偝傗埵抲偑暘偐傝堈偄傛偆偵偟偰偁傝傑偡丅
傑偢丄墧偺僷僀僾偵擖傟偨應掕婍傪丄崼曪梡偺僾僠僾僠偱俀廳偵曪傫偱壏搙曄壔偑彮偟娚傗偐偵側傞傛偆偵偟偰丄椻搥屔偵擖傟偰應掕偟傑偡丅
偱丄廫暘椻偊偨傜丄崱搙偼丄椻搥屔偐傜庢傝弌偟偰丄壏傑傞條巕傪應掕偟傑偡丅
僥儗儈僲俵俠俙偺僲乕僩傗丄僗儁僋僩儖僼傽僀儖偵丄俠倱俬俀丏俆偲偐彂偄偰偁傝傑偡偑丄偙傟偼丄曄峏偡傞偺傪朰傟偨巹偺儈僗偱丄
巊梡偟偨偺偼丄俶倎俬偺侾丏俆僀儞僠偺侾崋婡偱偡丅
傑偨丄俠倱侾俁俈偺俇俇俀俲倕倁偺僺乕僋偑丄摿偵嵍懁偑乽傆偔傛偐乿偵旍枮偟偰偄傜偭偟傖傞偺偼丄崱偺偲偙傠撲偱偡丅
偙偺棟桼傪抦偭偰偄傞曽丄壖愢偺偁傞曽偼丄嫵偊偰壓偝偄偹丅
慄検偑彫偝側慄尮傪巊偆偲丄偙偆側傜側偄偺偱丄僨傿僗僋慄尮傪棙梡偟偰慄検偑嫮偄偣偄偱偙偆側偭偰偄傞偺偱側偄偐偲巚偆偺偱偡偑丄
偦偺儊僇僯僘儉偲偐偼丄傑偩峫偊偰偄傑偣傫丅
寢壥偲偟偰偼丄彮側偔偲傕偙偺應掕婍偱偼丄椻傗偡偲塃偺僄僱儖僊乕偺崅偄曽偵僺乕僋偼摦偔丅
俠倱侾俁俈偺僺乕僋偼丄椻傗偡偲丄傕偟偐偟偨傜彮偟偩偗掅偔側傞偐傕丅乮偁傫傑傝帺怣側偟乯
僐儞僾僩儞僄僢僕偐傜丄墧偺倃慄傑偱偺椞堟偼丄嫮偄偰尵偊偽彮亅亅亅亅偟偩偗掅偔側偭偨傛偆側婥傕偡傞偗偳丄慡偔帺怣偑偁傝傑偣傫丅
偦偆偄偆偺偑庯枴偺曽偼丄倅倝倫僼傽僀儖偵偁傞僗儁僋僩儖僨乕僞傪僾儘僢僩偟偨傝偟偰丄挷傋偰傒偰壓偝偄丅
俁俀俲倕倁偵偮偄偰偼丄椻傗偡偲崅偔側傞丄偲尵偭偰傕椙偝偦偆偱偡丅
As I didn't like the result of my first attempt, I changed the configuration and tried, again.
This time, I used standard disc source of 0.25micro curie instead of 2g of soil sample so that I get the peak with better definition, quicker.
I used the Bin multiplier configuration of x2 to see finer temperature drift.
And I set
I used smoothing (IIR Filter) so that it's easier to see the drift of Cs137 peak.
First, I put the lead pipe and the detector in freezer to cool down, covered by 2 layers of plastic bags with air cushion to damper the temperature change.
Then I measured, again, as it warmed up.
Please note that the description of "CsI 2.5 N2" is my mistake as I forgot to change the note of another experiment.
I used the NaI 1.5 detector, like the first experiment.
Also, the peak of Cs137 at 662keV is somewhat fat, especially on its left side.
I do not know why it happens but I've seen this when I used this disc source and not with weaker soil samples.
Please let me know if you know the reason for this fat peak or if you have a theory.
I think we can conclude that the peak shifts to the right into higher energy, at least for this detector.
(It contains HV supply, amplifier, and USB codec for HID audio interface)
I'm not sure about what happens to the region between Compton edge and PbX.
I have an impression that this region becomes slightly lower as things cool down, but it's not very visible.
Other than that, the peak for 32keV seem to be higher as the temperature decreases (although the smoothing alter how it appears a lot).
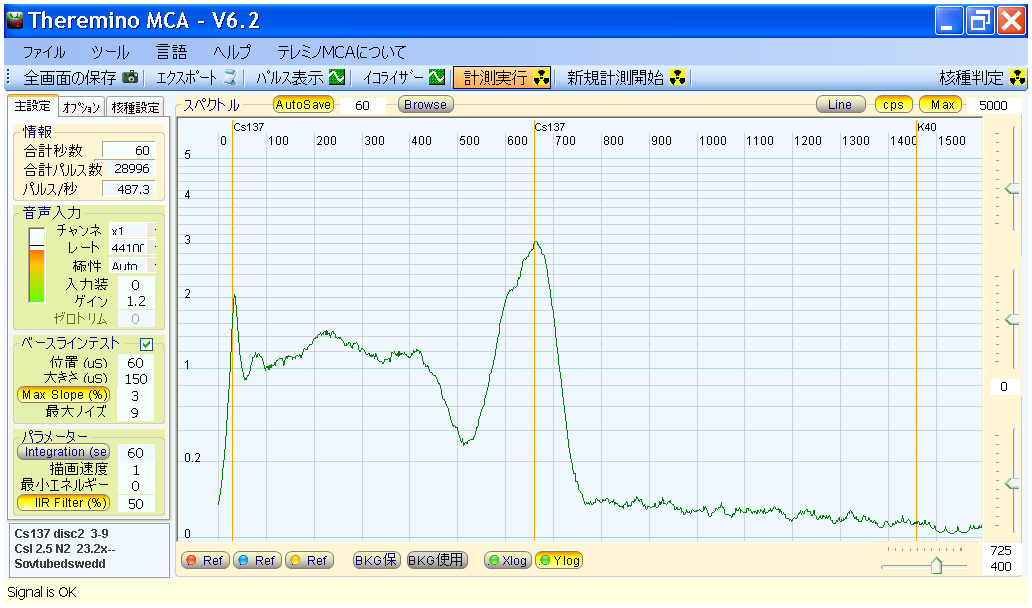
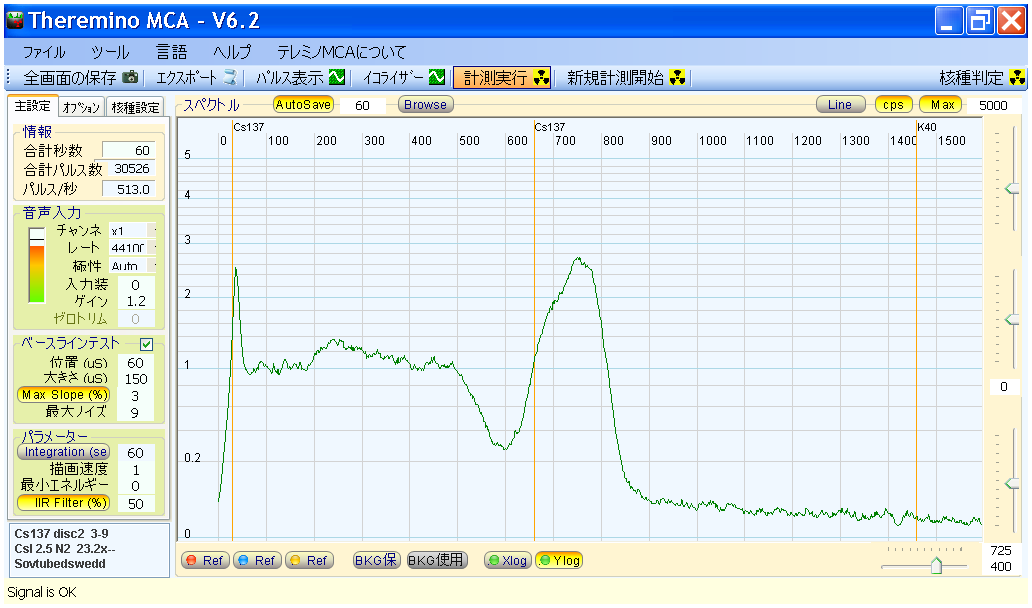
俀俁丏俁亷偐傜僗僞乕僩 Starting at 23.3C
崱夞偼丄幚尡傪僙僢僩偟偰丄怮偰偟傑偭偨偺偱丄壏搙偼丄庤摦偱擖傟偰側偄偺丄怽偟栿偁傝傑偣傫偑暘偐傝傑偣傫丅
偦偺戙傢傝丄堦帪娫偛偲偺僨乕僞傪嵹偣偰偍偒傑偡丅嵟廔揑偵偼丄儅僀僫僗侾侾搙偐丄偦傟傛傝彮偟掅偄偔傜偄偵摓払偟偨傛偆偱偡丅
偮傑傝丄俁侽亷偔傜偄偺壏搙曄壔偵傛傞僺乕僋偺堏摦側偺偱丄暘偐傝傗偡偄寢壥偵側偭偨偲巚偄傑偡丅乮墶幉偺堏摦偺曽岦惈偲偐偵偮偄偰偼乯
傑偨丄嵟屻偵丄搑拞宱夁偺慡偰偺僗儁僋僩儖傗夋憸傪擖傟偨倅倝倫僼傽僀儖傕抲偄偰偍偔偺偱丄嫽枴偺偁傞曽偼丄偛棗偔偩偝偄丅
As I just set the experiment and went to bed, there is no way to know exact temperature. Sorry.
At the end, it seems like the temperature was about -11C or even a little lower.
So,I'll show the data for each passing hour, and the zip file of all data in between for those who are curious enough to bother looking into these.
http://pico.dreamhosters.com/img/V60/2013_12_14_01_00_15-Cs137_disc2__3-9-CsI_2.5_N2__23.2x--.spe
http://pico.dreamhosters.com/img/V60/2013_12_14_01_00_15-Cs137_disc2__3-9-CsI_2.5_N2__23.2x--.txt
侾帪娫屻 After an hour

http://pico.dreamhosters.com/img/V60/2013_12_14_02_00_15-Cs137_disc2__3-9-CsI_2.5_N2__23.2x--.spe
http://pico.dreamhosters.com/img/V60/2013_12_14_02_00_15-Cs137_disc2__3-9-CsI_2.5_N2__23.2x--.txt
俀帪娫屻 After two hours

http://pico.dreamhosters.com/img/V60/2013_12_14_03_00_15-Cs137_disc2__3-9-CsI_2.5_N2__23.2x--.spe
http://pico.dreamhosters.com/img/V60/2013_12_14_03_00_15-Cs137_disc2__3-9-CsI_2.5_N2__23.2x--.txt
俁帪娫屻 After three hours
http://pico.dreamhosters.com/img/V60/2013_12_14_04_00_15-Cs137_disc2__3-9-CsI_2.5_N2__23.2x--.spe
http://pico.dreamhosters.com/img/V60/2013_12_14_04_00_15-Cs137_disc2__3-9-CsI_2.5_N2__23.2x--.txt
係帪娫屻 After four hours

http://pico.dreamhosters.com/img/V60/2013_12_14_05_00_15-Cs137_disc2__3-9-CsI_2.5_N2__23.2x--.spe
http://pico.dreamhosters.com/img/V60/2013_12_14_05_00_15-Cs137_disc2__3-9-CsI_2.5_N2__23.2x--.txt
俆帪娫屻 After five hours

http://pico.dreamhosters.com/img/V60/2013_12_14_06_00_15-Cs137_disc2__3-9-CsI_2.5_N2__23.2x--.spe
http://pico.dreamhosters.com/img/V60/2013_12_14_06_00_15-Cs137_disc2__3-9-CsI_2.5_N2__23.2x--.txt
慡僨乕僞丂The zip file for all data you may want to see
http://pico.dreamhosters.com/img/V60/2013_12_14_06_15_15-Cs137_disc2__3-9-CsI_2.5_N2__23.2x--.zip
偟偮偙偔丄傕偆堦夞丅 Yet another measurement series
傕偆丄偍暘偐傝偐偲巚偄傑偡偑丄巹偼屄恖揑偵擺摼偡傞傑偱丄偟偮偙偔壗搙傕帋偡恖側偺偱丄椻搥屔偐傜庢傝弌偟偨應掕婍偱崱搙偼壏搙偑忋徃偡傞條巕傪應掕偟偰傒傑偟偨丅
As some of you have already noticed, I keep measuring and repeat till I get satisfied.
So, I measured again after taking out the detector as it warms up.
儅僀僫僗侾侾亷偐傜僗僞乕僩 Starting at minus 11 degree Celsius
僺乕僋偺堏摦偑傢偐傝傗偡偄傛偆偵丄儅乕僇乕傪弌偟偰傒傑偟偨丅
壏搙曄壔偼丄怽偟栿偁傝傑偣傫偑丄偁傫傑傝婰榐偟偰傑偣傫丅
奐巒侾係暘屻偵丄儅僀僫僗俀亷偵側傝丄俀俋暘屻偵俉丏俆亷丄俈侾暘屻偵侾俉亷丄侾侽侾暘屻偵俀俀亷丄
侾侾俀暘屻偵俀俀丏係亷丄侾俀侽暘屻偵俀俀丏俈亷丄偦偺俆暘屻偵俀俁丏俀亷偱丄偦偺傑傑廔椆
I placed a marker so that it would be easier to see the drift.

http://pico.dreamhosters.com/img/V60/2013_12_14_10_49_06-Cs137_disc2__3-9-CsI_2.5_N2__11-upx.spe
http://pico.dreamhosters.com/img/V60/2013_12_14_10_49_06-Cs137_disc2__3-9-CsI_2.5_N2__11-upx.txt
侾帪娫屻 After an hour
婛偵丄偐側傝乮敿暘埲忋乯堏摦偟傑偟偨丅壏搙曄壔偼丄弌偩偟偺曽偑帪娫摉偨傝偺曄壔検偑懡偄偺偱丅
Already, the peak shifted more than a half. It worms up more at the beginning.
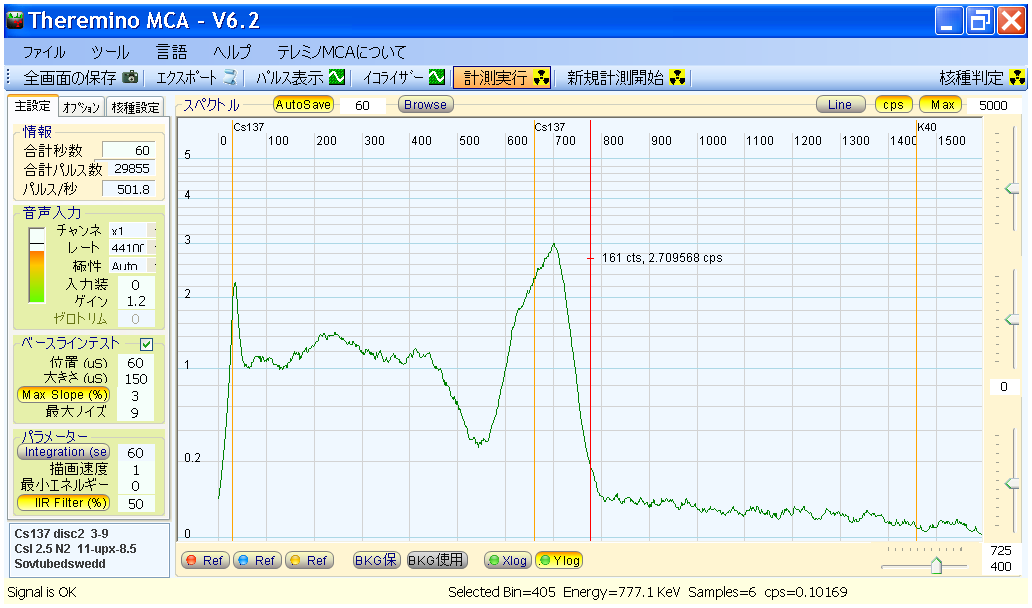
http://pico.dreamhosters.com/img/V60/2013_12_14_11_49_06-Cs137_disc2__3-9-CsI_2.5_N2__11-upx-8.5.spe
http://pico.dreamhosters.com/img/V60/2013_12_14_11_49_06-Cs137_disc2__3-9-CsI_2.5_N2__11-upx-8.5.txt
俀帪娫屻 After two hours
俀帪娫偱丄傎傏尦捠傝偵側傝傑偟偨丅
It only took 2 hours to get back to the original position.
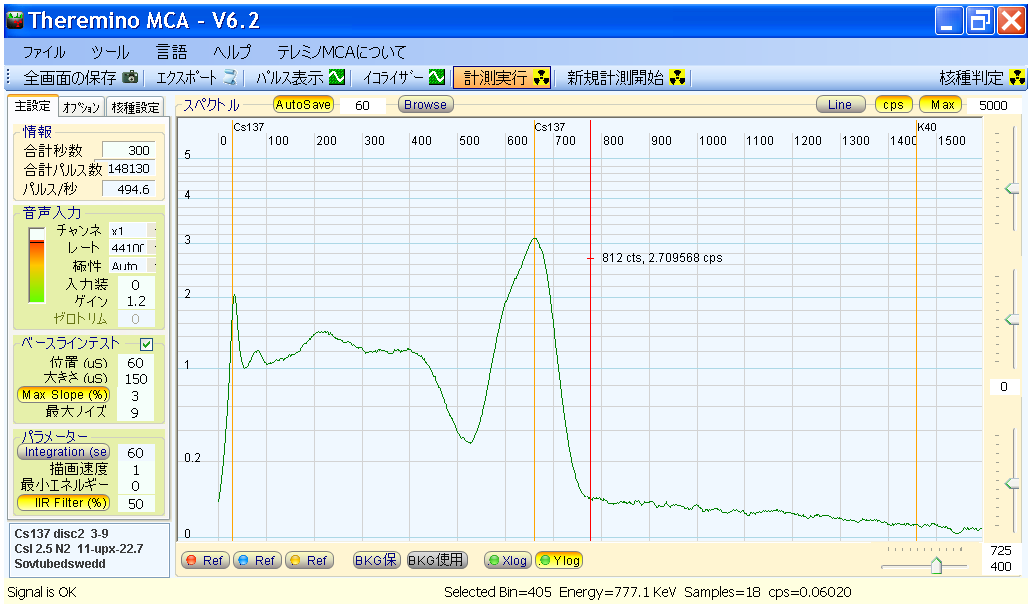
http://pico.dreamhosters.com/img/V60/2013_12_14_12_49_06-Cs137_disc2__3-9-CsI_2.5_N2__11-upx-22.7.spe
http://pico.dreamhosters.com/img/V60/2013_12_14_12_49_06-Cs137_disc2__3-9-CsI_2.5_N2__11-upx-22.7.txt
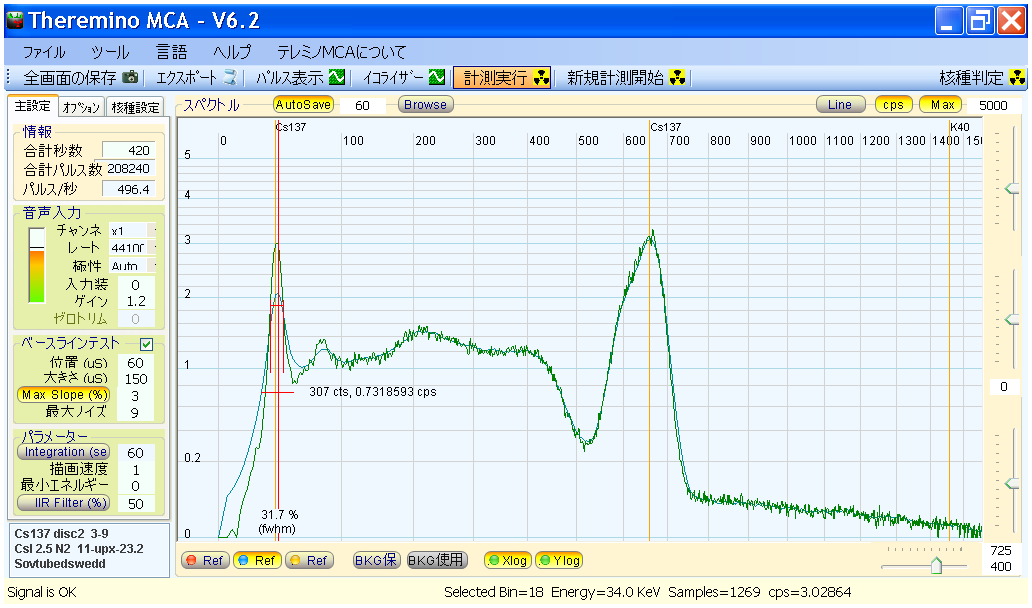
僗儉乕僕儞僌偺桳柍傪僠僃僢僋 Turning the smoothing on and off
悈怓偑僗儉乕僕儞僌偁傝乮俬俬俼僼傿儖僞乕俆侽亾乯丅椢偑側偟丅
The blue line is with smoothing (IIF Filter 50%). The green line is all natural.
http://pico.dreamhosters.com/img/V60/2013_12_14_12_55_37-Cs137_disc2__3-9-CsI_2.5_N2__11-upx-23.2.spe
http://pico.dreamhosters.com/img/V60/2013_12_14_12_55_37-Cs137_disc2__3-9-CsI_2.5_N2__11-upx-23.2.txt
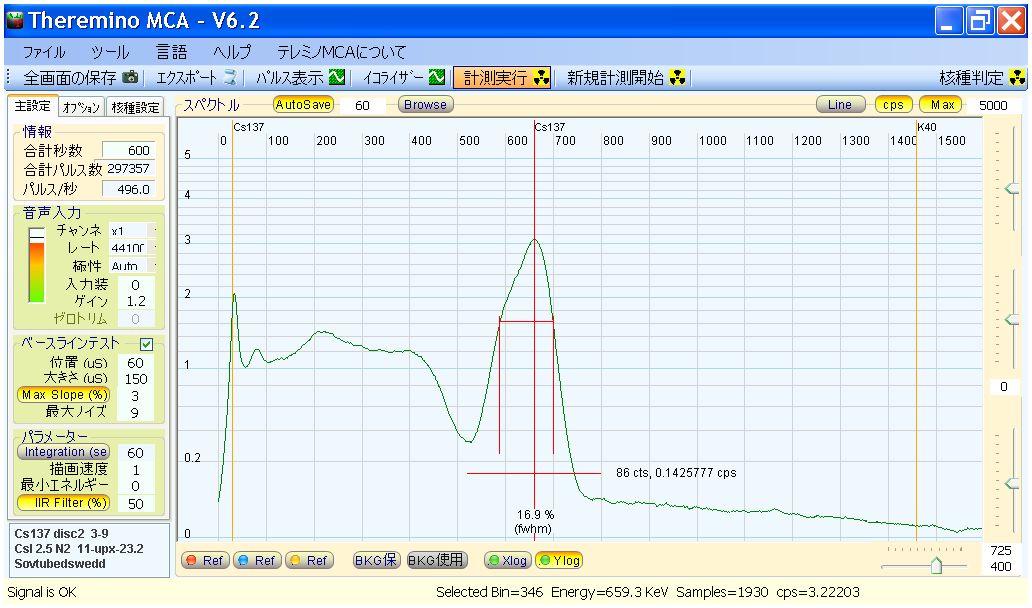
俇侽侽昩應傞偲丄偙傫側姶偠丅丂If I measure 600 seconds, it becomes smoother like this
http://pico.dreamhosters.com/img/V60/2013_12_14_12_54_06-Cs137_disc2__3-9-CsI_2.5_N2__11-upx-23.2.spe
http://pico.dreamhosters.com/img/V60/2013_12_14_12_54_06-Cs137_disc2__3-9-CsI_2.5_N2__11-upx-23.2.txt
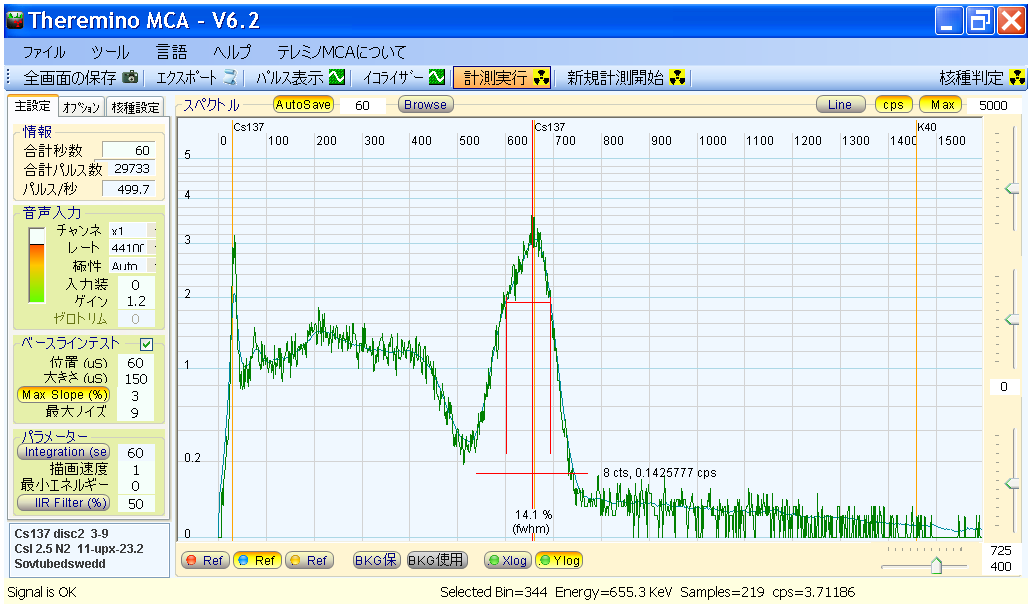
俁俀俲倕倁偺條巕丂 Seeing more closely into the 32keV peak
倃幉乮墶幉乯傕懳悢昞帵偵偟偰丄掅偄傎偆傪堷偒怢偽偟丄俁俀俲倕倁偑彮偟尒傗偡偔側傞傛偆偵偟偰丄俥倂俫俵偺昞帵傕偝偣偰傒傑偟偨丅
偨偩偟丄偙偺悢抣偲偐偼丄偁傫傑傝惓妋偱偼側偄偱偟傚偆丅
椢偺慄偑僗儉乕僕儞僌側偟丅悈怓偑俆侽亾偺俬俬俼僼傿儖僞乕傪偐偗偨僗儁僋僩儖丅
I used XLog button to better show the lower energy region.
I showed FWHM, but the number isn't necessarily very accurate.
The green line is without smoothing. The blue line is with 50% IIR filter.
http://pico.dreamhosters.com/img/V60/2013_12_14_13_01_37-Cs137_disc2__3-9-CsI_2.5_N2__11-upx-23.2.spe
http://pico.dreamhosters.com/img/V60/2013_12_14_13_01_37-Cs137_disc2__3-9-CsI_2.5_N2__11-upx-23.2.txt
壏傑傞條巕偺倅倝倫僼傽僀儖 Zip file of warming up process
嶲峫暥專丂Documents
Temperature behavior of NaI (Tl) http://arxiv.org/ftp/physics/papers/0605/0605248.pdf Very interesting
How to counter the temperature drift丂http://ecad.tu-sofia.bg/et/2006/ET2006%20BOOK%202/Quantum%20and%20Nuclear%20Electronics/138%20Paper-M_Mitev.pdf
PMT (not crystal, though) http://icrc2009.uni.lodz.pl/proc/pdf/icrc0811.pdf
Temperature and Noise http://www.bnl.gov/ispo/BNLWorkshop07/Presentations/Ianakiev%20EM%20accuracy.ppt