Gnuplotで(線量などの)グラフを作るためのメモ パート2
Gnuplot Memo や
Gnuplot Memo3D の続きです。
Gnuplotで私が使う方法とかのメモです。
ファイルから数値や文字列を読み込む (ab)Using stats command to read data from a file
Gnuplotで任意のファイルを読み込んで、その中身のテキストや数値を変数に入れたり、
それらを使ってグラフを作ったり出来ます。
Plotコマンドでも、Statコマンドでも出来ますが、Statコマンドの方が便利かも。
Ver5.0rc以降でないと、少々変更が必要かも。
Probably require V5.0rc or later of Gnuplot.
#マクロを許可
set macro
#マクロを定義。
#データの区切り文字を、var_sep に変更し、
#statsでもって、var_str の文字列を含む行の数字以外は、ゼロを返す。
#データの区切り文字をリセット。
#var に結果を格納。
var_set='set datafile separator var_sep;\
stats f every ::1::60 u 0:(strstrt(stringcolumn(1),var_str)>0?column(2):0) nooutput;\
unset datafile separator;\
var=STATS_max_y'
#使うときは、最初の1回は区切りを定義。
var_sep=":"
#読み込む行に含まれる文字列を指定
var_str="Total time"
#マクロを呼び出し。この例では、その後に、結果を表示
@var_set;print var
ファイルに何か書き出す
こんな風にすると、file.txt に whatever と書き込まれる。読み出すより簡単。
set print 'file.txt'
print 'Whatever'
unset print
追加で書き込むには、append を付けるだけで良いそうです。
set print 'file.txt' append
つまり、こういうのを使って、スクリプトでコマンドスクリプトを生成して、
それを実行する、といったことも出来ます。
ヘルプに色々書いてあります。
データブロックに書き出す、というのも、使えそう。
print
The set print command redirects the output of the print command to a file.
Syntax:
set print
set print "-"
set print "<filename>" [append]
set print "|<shell_command>"
set print $datablock [append]
Without "<filename>", the output file is restored to <STDERR>. The <filename> "-" means <STDOUT>. The append flag causes the file to be opened in append mode. A <filename> starting with "|" is opened as a pipe to the <shell_command> on platforms that support piping.
The destination for print commands can also be a named data block. Data block names start with '$', see also inline data.
プロットに使われたデータをファイルに書く
ここの受け売りです。
http://www.ss.scphys.kyoto-u.ac.jp/person/yonezawa/contents/program/gnuplot/table.html
こんな風にすると、プロットしたデータが保存されます。
set table 'plotdat.txt'
plot sin(x)
unset table
ヘルプから。やはり、データブロックがあるのと、Plotコマンドで、with table とやると、無駄な作業をしなくなって少し早くなりそう。
table
When table mode is enabled, plot and splot commands print out a multicolumn text table of X Y {Z} R values rather than creating an actual plot on the current terminal. The character R takes on one of three values: "i" if the point is in the active range, "o" if it is out-of-range, or "u" if it is undefined. The data format is determined by the format of the axis tickmarks (see set format), and the columns are separated by single spaces. This can be useful if you want to generate contours and then save them for further use. The same method can be used to save interpolated data (see set samples and set dgrid3d).
Syntax:
set table {"outfile" | $datablock}
plot <whatever>
unset table
Tabular output is written to the named file, if any, otherwise it is written to the current value of set output. Alternatively, tabular output can be redirected to a named data block. Data block names start with '$', see also inline data. You must explicitly unset table in order to go back to normal plotting on the current terminal.
To avoid any style-dependent processing of the input data (smoothing, errorbar expansion, secondary range checking, etc), or to increase the number of columns that can be tabulated, you can use the keyword "table" instead of a normal plot style. For example
set table
plot <file> using 1:2:3:4:5:6:7:8:9:10 with
データをファイルから読んで文字列アレーに入れる Storing data into string array
BGs=''  # 文字列を初期化
stat 'filename.txt' u 0:((BGs=sprintf('%s %s',BGs, stringcolumn(1))),1)
XRFスペクトルの表示 Showing XRF (or Characteristic X-ray) spectrum
このサイトにXRFスペクトルが沢山あります。
We can find many XRF (or Characteristic X-ray) spectrum.
http://ie.lbl.gov/xray/mainpage.htm
データファイルは、以下のURLの様に、元素記号.txt の形で入れるだけ。
To see the data file, simply replace Eu with desired element.
http://ie.lbl.gov/xray/Eu.txt
Cygwinとかがあって、シェルスクリプトを使えるなら、
こういう簡単なスクリプトで、全データファイルを落とせます。
We can download all data with simple shellscript (with Linux, Cygwin, etc)
e='Al Ca Sc Ti V Cr Mn Fe Co Ni Cu Zn Ga Ge As Se Br Rb Sr Y Zr Nb Mo Tc Ru Rh Pd Ag Cd In Sn Sb Te I Xe Cs Ba Hf Ta W Re Os Ir Pt Au Hg Tl Pb Bi La Ce Pr Nd Sm Eu Gd Tb Dy Ho Er Tm Yb Lu Th U'

for n in $e
do
 wget 'http://ie.lbl.gov/xray/'$n'.txt'
done
自分でいちいち取ってくるのが面倒な人の為に、全部まとめて入っているZipファイルを作っておきました。
For you lazy people, I made a zip file containing all spectrum data files.
http://pico.dreamhosters.com/raddata/xrf.zip
Gnuplotでなくても、エクセルでもRでも、使い慣れたものでご覧になれます。
You can use Excel or R or any software to plot the XRF spectrum.
Gnuplotのコマンドは、こんな感じ。
Gnuplot command would be like this.
plot 'Eu.txt' u 2:3 every ::10 with line
複数の元素を一緒に出したい時は、こんな風にコンマで区切って並べます。
You can show multiple elements by adding after comma.
plot 'Eu.txt' u 2:3 every ::10 with line, plot 'Am.txt' u 2:3 every ::10 with line
他の方法としては、文字列に元素記号を並べて入れておいて、
それでもってループさせてプロットさせることも出来ます。こっちの方が簡単。
You can use string array and for loop to show.
This is much easier.
elems='Eu Sm W'
plot for [n=1:words(elems)] sprintf('%s.txt',word(elems,n)) u 2:3 every ::10 with line t word(elems,n)
コマンドを文字変数に入れておけば、マクロで簡単に呼び出せます。
You can put the command in a string variable, and use it as a macro.
xrf="plot for [n=1:words(elems)] sprintf('%s.txt',word(elems,n)) u 2:3 every ::10 with line t word(elems,n)"
@xrf
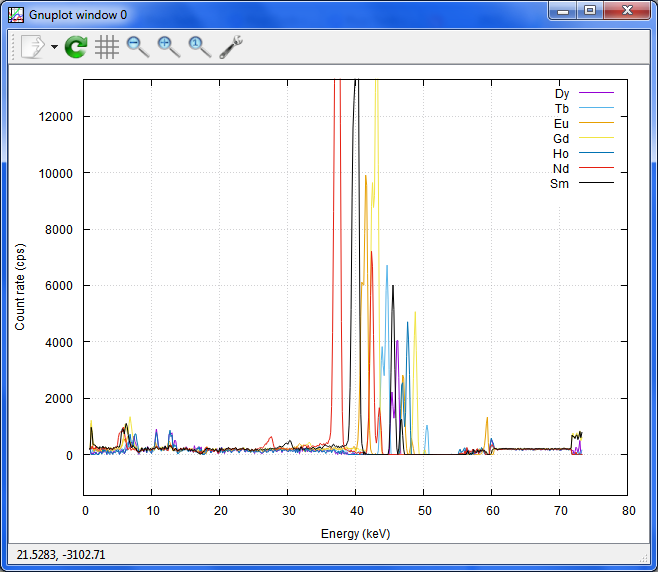
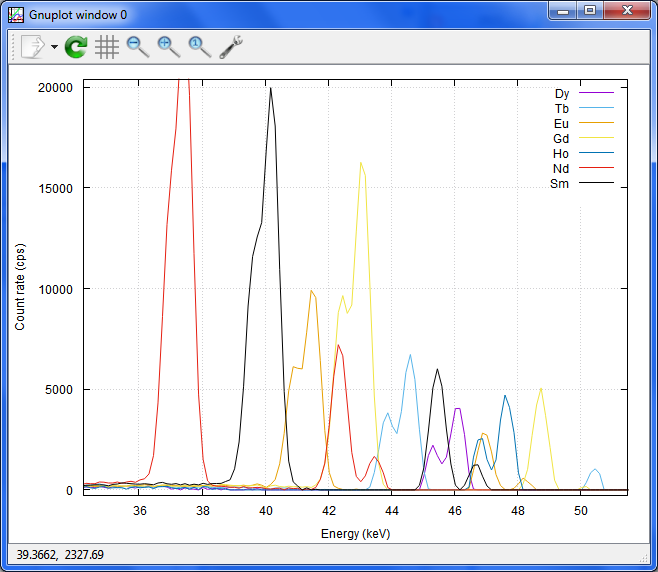
例:(縦軸は、cpsとなってますが、単なるカウント数です。)
Ex: (The vertical axe is counts, rather than cps)
元素を文字列に適当に並べてセット。
Set the elements in the string variable used as string array.
elems='Dy Tb Eu Gd Ho Nd Sm'
それを全部プロット。
Plot them all.
plot for [n=1:words(elems)] sprintf('xrf/%s.txt',word(elems,n)) u 2:3 every ::10 with line t word(elems,n)


プロットシェアも便利。
Plotshare is great!
http://www.plotshare.com/index.ws/plot/443757648

おまけ:
特性X線のリストとしては、おおよその放出率が付いているので、私にとっては、これが一番参考になります。
This page shows the list of X-ray lines for each element with approximate emission rate!
http://www.kayelaby.npl.co.uk/atomic_and_nuclear_physics/4_2/4_2_1.html