3インチNaIプローブによるメープルシロップのスペクトル Maple Syrup spectrums with 3 inch NaI probe
2.5インチCsI測定器で測ったスペクトルはこちら。
Previously, I've measured the same maple syrup with 2.5 inch CsI probe (Sovtube Detector).
今回は、昨年(2013年)暮れに購入した中古の3インチNaI検出器(約10万円)のテストで、既に測って様子が分かっているメープルシロップを再度測定して見ました。
テレミノPMTアダプターを使用して650Vで測りました。
ただ、前回マリネリから取り出した後にメープルシロップを若干こぼしてしまったので、セシウムの量がほんの少し減っているのと、大きいジップロック袋に入れたままではEMF211用のマリネリにピッチリと収まらなかったので、最善の詰め込み方とは言えない状態です。
To test newly acquired 3 inch NaI probe, I measured the maple syrup, again.
I used Theremino Pmt Adapter, this time, instead of USB-MCA.
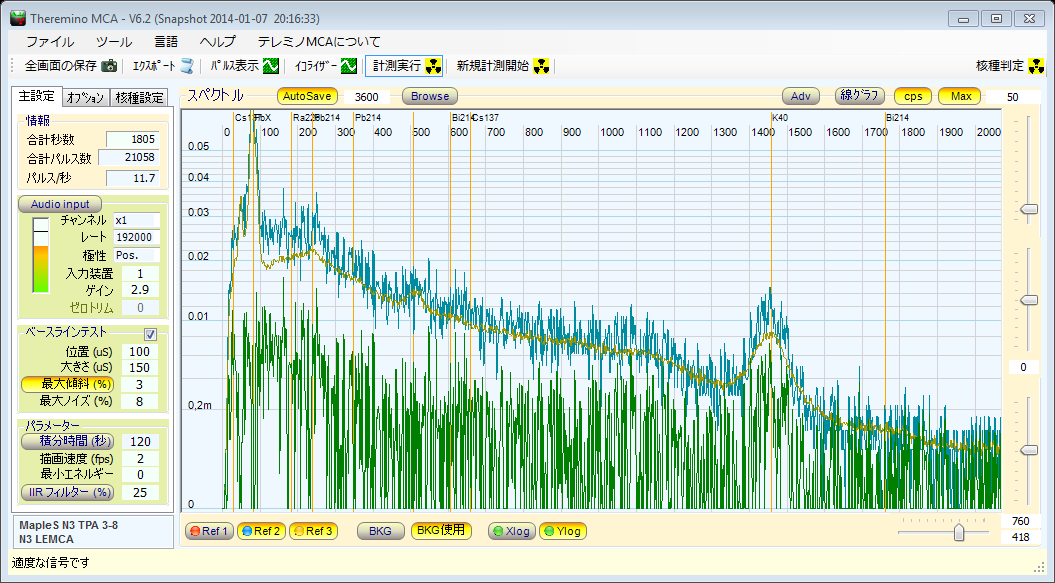
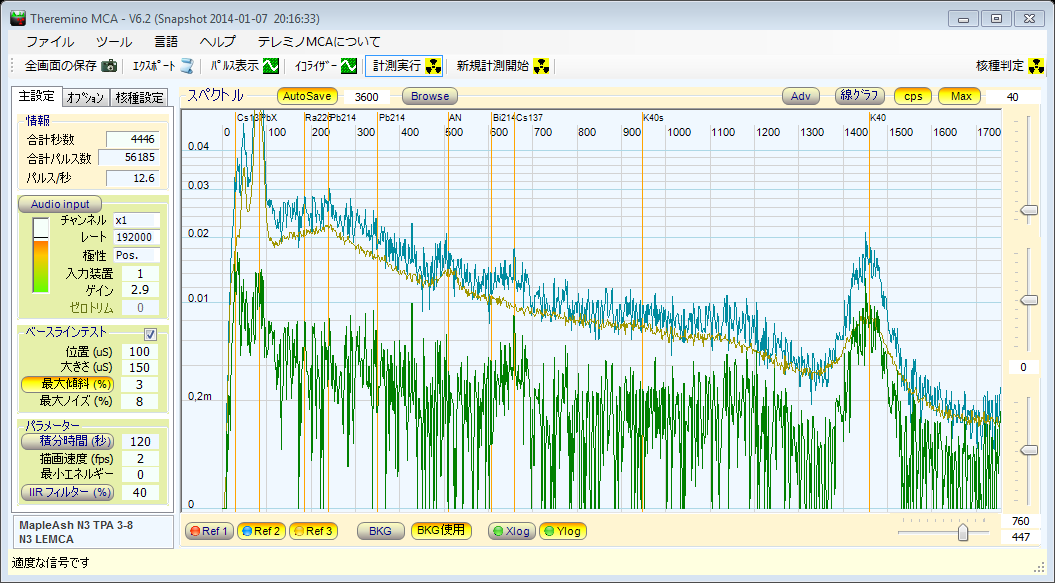
測定開始30分後 After 30minutes
K40の1460KeVの山は、水色の線のギザギザが既にバックグラウンド(黄色の線)よりも、ほぼ完全に上に出ているので、
K40がこの検体に存在するのは、確かだと思ってよいでしょう。その他は、エネルギーの低い方が(100−180KeVくらい)で
やはりスペクトルがバックグラウンドよりも高くなっていますが、それ以外はまだまだ分からない状態。
We can see that jagged line (blue) is over the background around K40 peak, indicating the presence of potassium in this syrup.
http://pico.dreamhosters.com/img/V60/2014_01_24_19_26_04-MapleS_N3_TPA_3-8-N3_LEMCA.spe
http://pico.dreamhosters.com/img/V60/2014_01_24_19_26_04-MapleS_N3_TPA_3-8-N3_LEMCA.txt
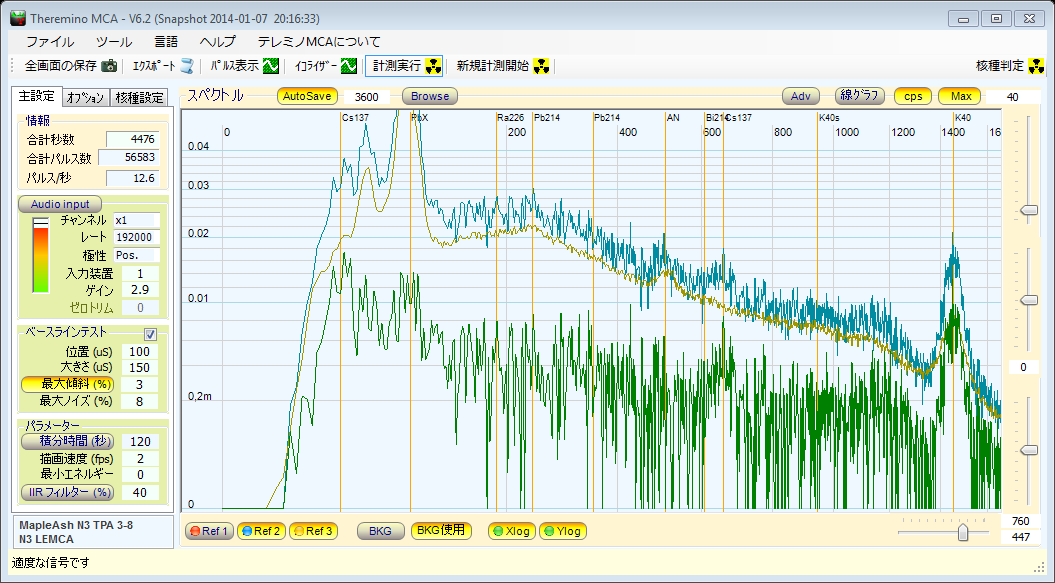
エネルギーの低いほうをXlogで拡大して、32KeVがもしかしたら見えるのか?とか、調べています。
Checking lower energy region using logarithmic display with Xlog button.
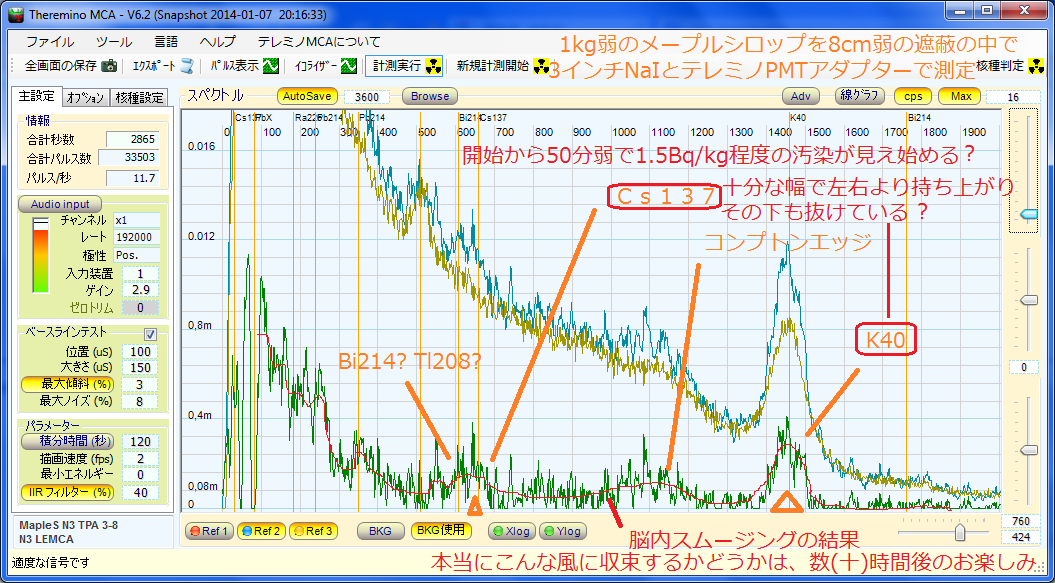
測定開始後50分くらいで、スムージングをかけ(緑の線)、更に「脳内スムージング」で(赤い手書きの線)、今後どうなるのか?を予想してみました。
Applying the smoothing with 40% IIR Filter(the green line), and then creating mental image of fully developed spectrum (the red line), I'm guessing what I would see in the end.
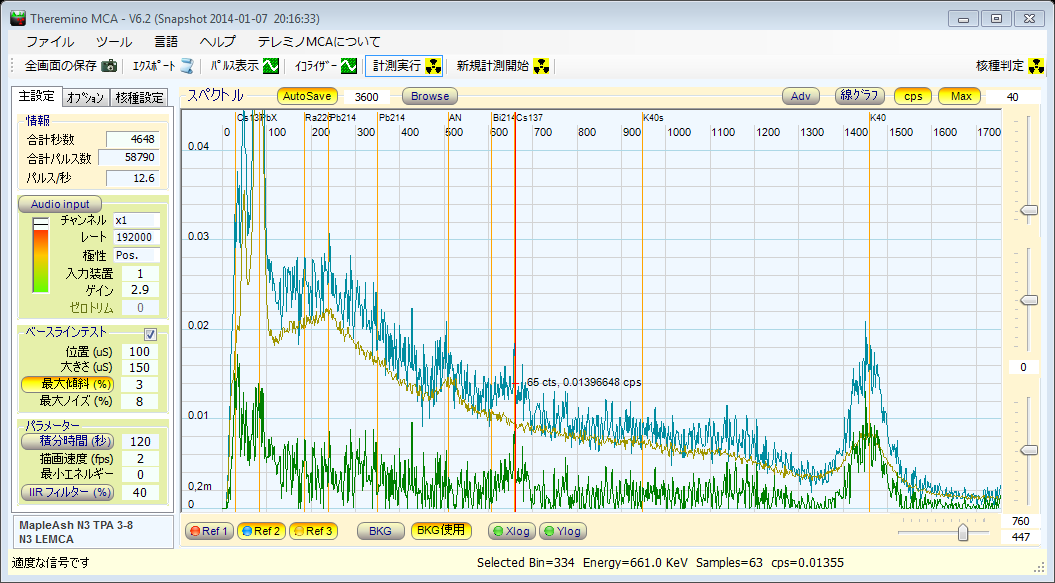
測定開始4時間後 After 4 hours
スムージング無しでも、K40のところに山があるのは分かりますし、K40の左側がコンプトン散乱で持ち上がっているのも(K40の右側との比較で)分かりますが、セシウム137があるかどうかわ、ちょっとよく分からない状態。
Without any smoothing, we can see the peak at K40 and the trend for Compton scattering to the left of K40 Peak.
However, the region of Cs137 isn't quite clear if there would be a peak or not.

http://pico.dreamhosters.com/img/V60/2014_01_24_22_58_55-MapleS_N3_TPA_3-8-N3_LEMCA.spe
http://pico.dreamhosters.com/img/V60/2014_01_24_22_58_55-MapleS_N3_TPA_3-8-N3_LEMCA.txt
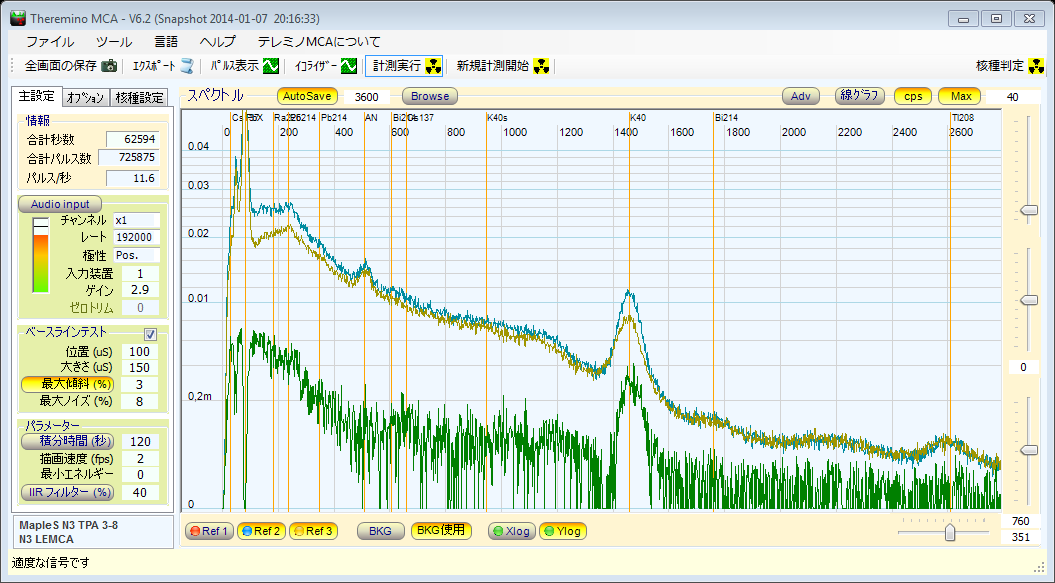
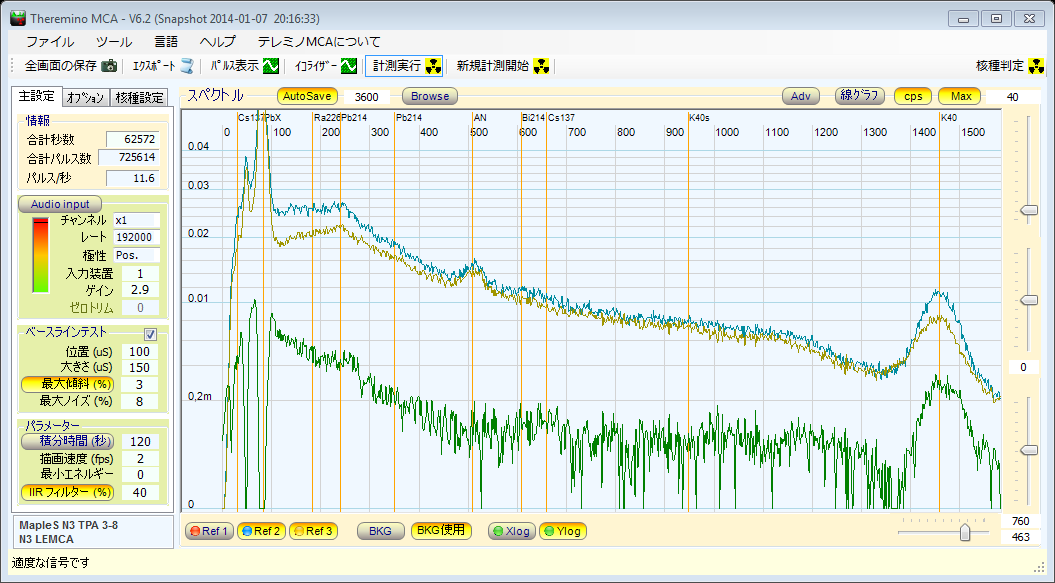
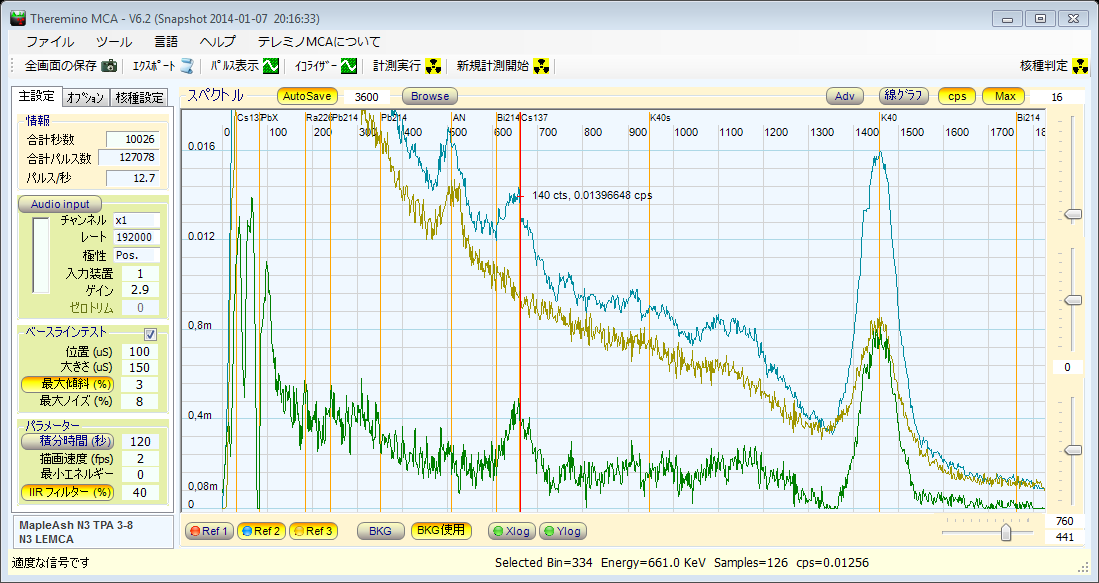
測定開始から17時間後 After 17 hours
K40の山は、大分綺麗になってきましたが、そお左側のコンプトン散乱の丘は、まだギザギザがあんまり収まっていません。K40の右側は、バックグラウンドとほぼ同じと見て良いでしょう。
セシウム137の領域は、微妙です。汚染があると、既に以前の測定から分かっているので、スムージングをかけたり、あるいはギザギザの中央を想像してコンプトン散乱の丘をイメージすると、それよりも若干持ち上がっていると思えますが、初めて測る検体だったら、このスペクトルを見て、Cs137が入っていると断言する気にはなれないかも。
K40 peak is now well developed into bell shape. The Compton scattering isn't rally as smooth as the K40 peak yet.
The right side of K40, to the higher energy, I guess we can safely declare that it's pretty much the same thing as the background and thus not much Thorium nor Uranium series in this maple syrup.
I would hesitate to say something definite about the presence of Cs137, "as is" without smoothing, etc.
http://pico.dreamhosters.com/img/V60/2014_01_25_12_33_32-MapleS_N3_TPA_3-8-N3_LEMCA.spe
http://pico.dreamhosters.com/img/V60/2014_01_25_12_33_32-MapleS_N3_TPA_3-8-N3_LEMCA.txt
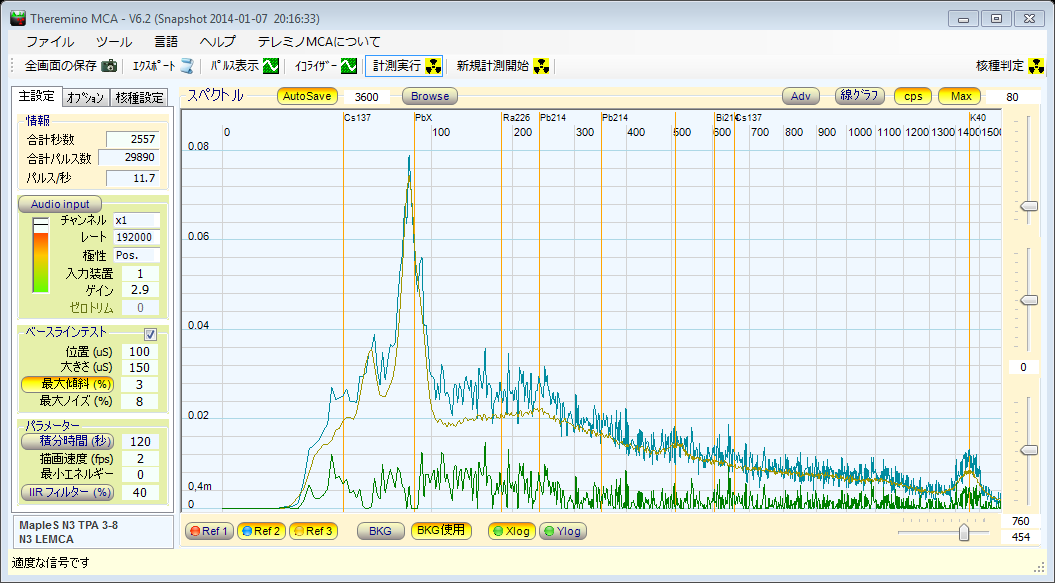
K40の山の辺りまでを表示して、IIRフィルターで40%のスムージングをかけたスペクトル。
よく見ると、700KeVから右側のコンプトン散乱は、最初の目盛り(0.0002cps)よりもちょっと低くなってますが、セシウム137の付近は、十分な幅で、コンプトン散乱の丘の上よりも高くなっています。
結局、最初の方の予想とそんなに違わない結果になった様に思いますが、Cs137の辺りは、もう少し盛り上がってくるかと思っていました。
この結果「だけ」見て比べると、CsI2.5インチの方が、このNaI3インチよりも、山が分かりやすい様にも思えます。(MapleSyrupSpectrums 18時間後のスペクトルと比較した場合)
今後、詰め込み方や高圧電源の電圧などを変えて、再度試してみる予定です。
With 40% IIR Filter smoothing, we can see that Cs137 region is slightly higher than the rest of the Compton scattering to the right. So, although marginal, I would strongly suspect the presence of Cs137 even if I didn't know anything about this syrup.
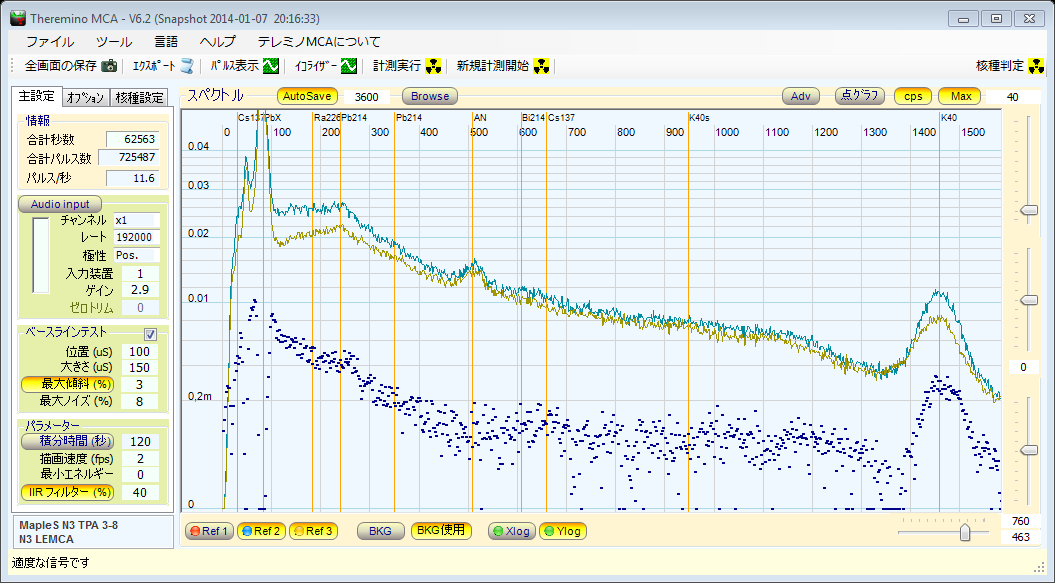
点グラフだと、こんな感じ。ギザギザの下の「抜け方」が、この方が分かりやすい場合もあります。
With dot, sometime, it seems easier to see the blanked out space below peak.
1.5リットルのメープルシロップを灰化した検体 Ashed down maple syrup
測定環境の確認の為に灰化したメープルシロップを測定して見ました。
こっちは、約1.5倍の量のセシウム137が、12gの灰に凝縮してあるので、測定器にとっては効率がよく検出できる検体です。
検体には全部で、とっても大雑把に2.5BqくらいのCs137が含まれていると推測されます。
水色がバックグラウンドを差っぴく前のスペクトル。茶色は、メープルシロップ(灰化してないもの)のスペクトル。
黄色がバックグラウンド。緑がBG差分です。
To verify the detector setup, I measured ashed down maple syrup.
It weighs 12g ashed from about 1.5 little of maple syrup containing (very) roughly 1.5Bq/kg of Cs137.
This is an easy thing to measure and get predictable result.
測定開始後20分弱で、100%のスムージングをかけると、既に、K40とCs137の山が見えます。
Twenty minutes after starting, we can see the presence of Potassium 40 and Cesium 137 with 100% IIR Filter smoothing.
http://pico.dreamhosters.com/img/V60/2014_01_25_12_56_49-MapleAsh_N3_TPA_3-8-N3_LEMCA.spe
http://pico.dreamhosters.com/img/V60/2014_01_25_12_56_49-MapleAsh_N3_TPA_3-8-N3_LEMCA.txt
40%のスムージングだと、こんな感じ。
With 40% IIR Filter smoothing.
1時間ちょっと経ったところです。スムージング無しの生スペクトルでも、K40とCs137の山が見えます。
After 1 hour. We can see K40 and Cs137 without smoothing.
http://pico.dreamhosters.com/img/V60/2014_01_25_13_54_33-MapleAsh_N3_TPA_3-8-N3_LEMCA.spe
http://pico.dreamhosters.com/img/V60/2014_01_25_13_54_33-MapleAsh_N3_TPA_3-8-N3_LEMCA.txt
低い方の状況
Checking lower energy region (for 32keV).
Ylogボタンを切ってリニア表示にすると、分かりやすい場合もありますし、単純な山の高さの比較などには、こっちの方がやりやすいです。
Turing off Ylog button, it's sometime easier for me to see things with linear display.
3時間弱の測定で、40%のIIRフィルターによるスムージングでこうなりました。
結果のでやすい簡単な検体で確かめながら、測定環境の特徴に慣れていきます。
A bit less than 3 hours of measurement. With 40% IIR Filter smoothing.
It's nice to have easy to detect samples to check the setup.
http://pico.dreamhosters.com/img/V60/2014_01_25_15_41_47-MapleAsh_N3_TPA_3-8-N3_LEMCA.spe
http://pico.dreamhosters.com/img/V60/2014_01_25_15_41_47-MapleAsh_N3_TPA_3-8-N3_LEMCA.txt
マリネリに詰めなおして、メープルシロップの再測定
メープルシロップをマリネリ容器に詰める方法を若干工夫して、効率が少し良くなる様にして、再測定してみました。
I changed the way I put the maple syrup in the Marinelli beaker to obtain better efficiency.
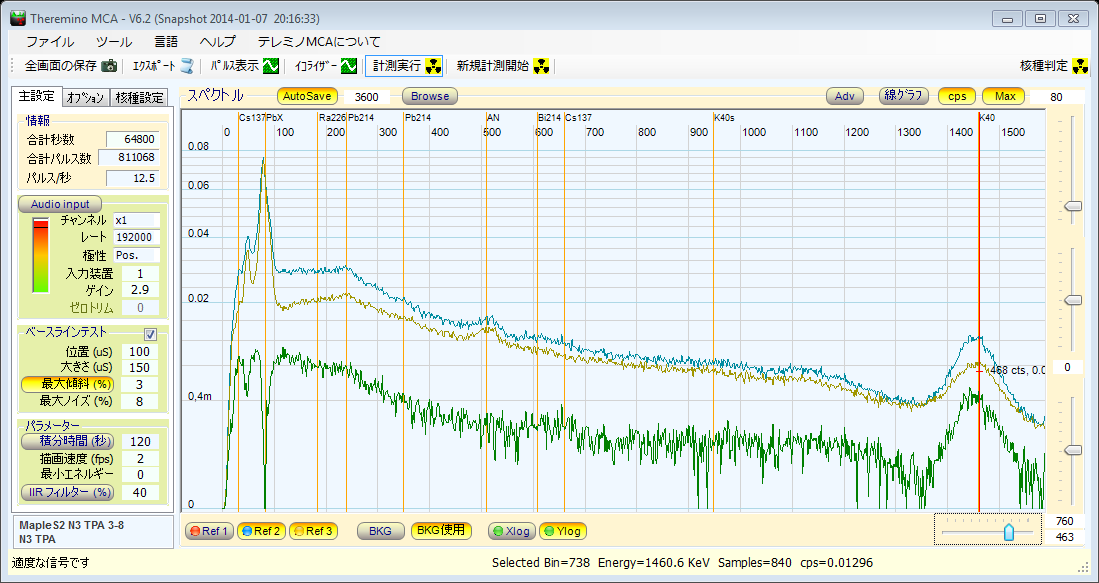
2時間後の様子ですが、ちょっとK40の山が「あれ?」と思うような形です。気温でも変化したのかな?とか思いますし、Cs137の近辺も、
盛り上がりが少し、左にズレている様な気もします。でも、こういうバラツキは、そんなに珍しくもないですし、後で丸まってくる場合が多いので、
どうなるか見守ります。
また、全体のcpsの数値は、前回の測定より若干上がっており、マリネリ容器への詰め方が前回よりもマシになっているからだ、と解釈しておきます。
(測定環境の変化など、他の理由の可能性もあるので、ぬか喜びはできません)
After 2 hours, the peak of K40 isn't nicely shaped. I thought about the possibility of temperature drift.
Also, the region of Cs137 seems to be slightly drifted to the left.
As this is very weak sample and the count rate is very low, it's not unusual to see strange things, especially at the beginning of measurement. So I keep watching what happens.
The total cps is at least higher than previous measurement, and what I did worked as planned.
http://pico.dreamhosters.com/img/V60/2014_01_25_17_44_04-MapleS2_N3_TPA_3-8-N3_TPA.spe
http://pico.dreamhosters.com/img/V60/2014_01_25_17_44_04-MapleS2_N3_TPA_3-8-N3_TPA.txt
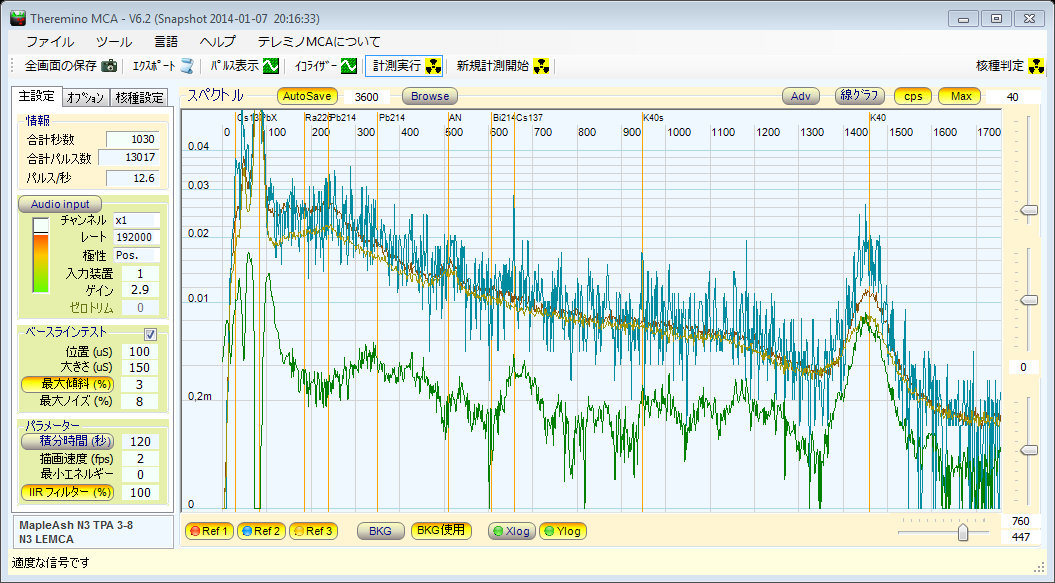
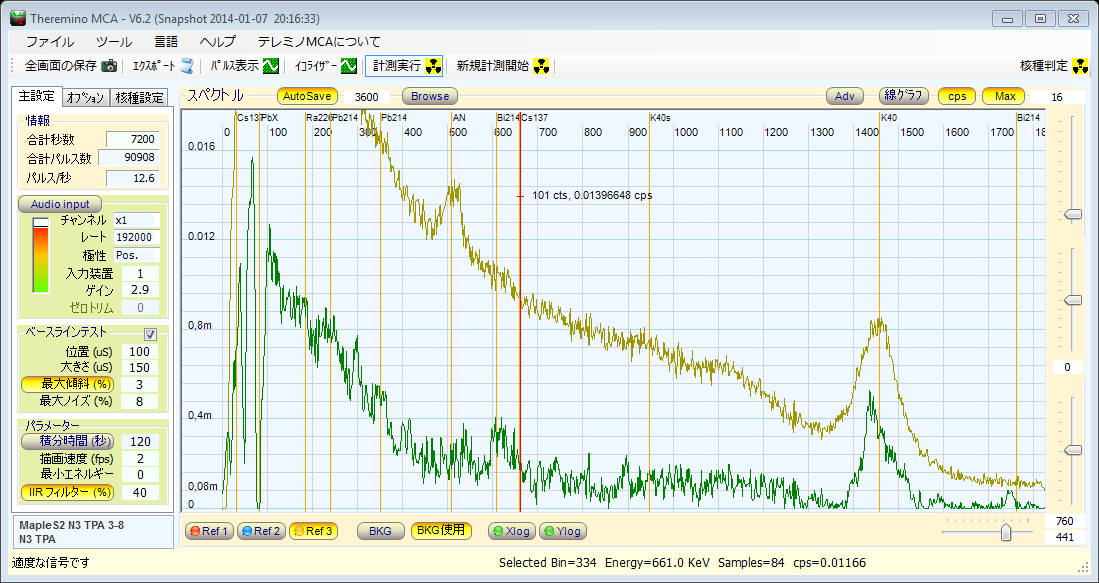
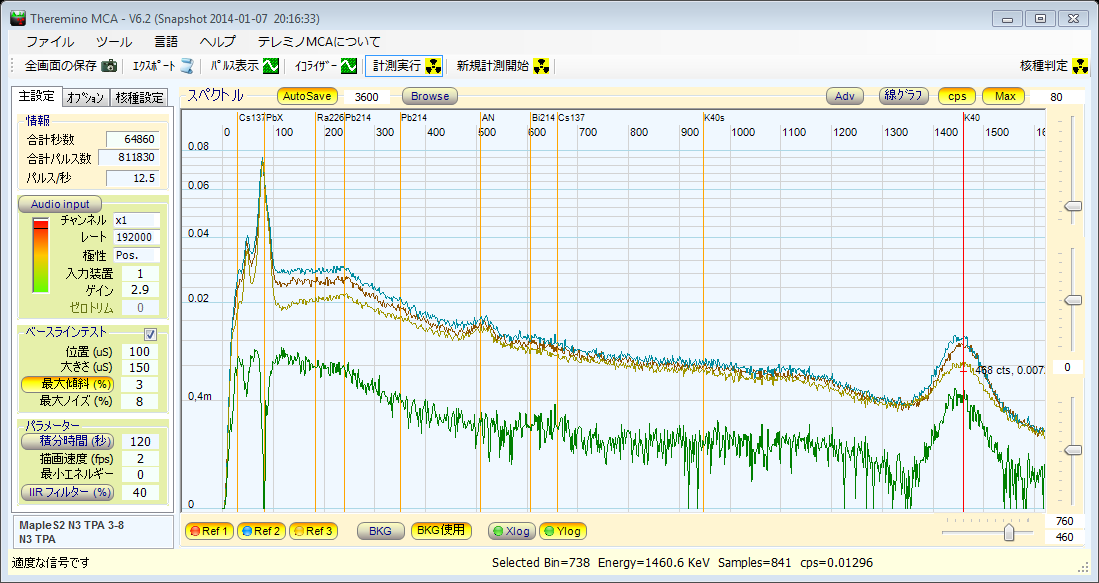
18時間弱放置したら、K40の山の形もまあまあになってきたし、スペクトルも心なしか前回の測定より落ち着いて、
スムージング無しでもコンプトン散乱の丘の形やCs137の存在が分かります。
また、前回は、あんまりよく分かりませんでしたが、Bi214の609KeVがあるみたいに見えます。
(510KeVも若干持ち上がっているようなので、あるいは、Tl208?)
今回は、検体の詰め方を変えたので、違いが出るのは当然なのですが、何も変えなくても、スペクトルの成長過程や
落ち着き方は毎回変わってきますし、天候の変化があったり、気温が変わったりすれば、なおさらです。
昨夜は、多少吹雪いていたので、もしかしたらラドン濃度などに少し変化があって、Bi214が若干増えたのかもしれません。
そして、これくらいの微妙な汚染の検体だと、本当に少しの量や効率の違いで、結構大きな差が出ることになったりします。
After 18 hours, the spectrum is more or less stabilized and we can see the K40 peak with Compton scattering, as well as the Cs137 at 662keV (and probably Bi214 at 609keV), even without any smoothing.
The Bi214 might be the result of small snow storm we had last night.
http://pico.dreamhosters.com/img/V60/2014_01_26_09_54_07-MapleS2_N3_TPA_3-8-N3_TPA.spe
http://pico.dreamhosters.com/img/V60/2014_01_26_09_54_07-MapleS2_N3_TPA_3-8-N3_TPA.txt
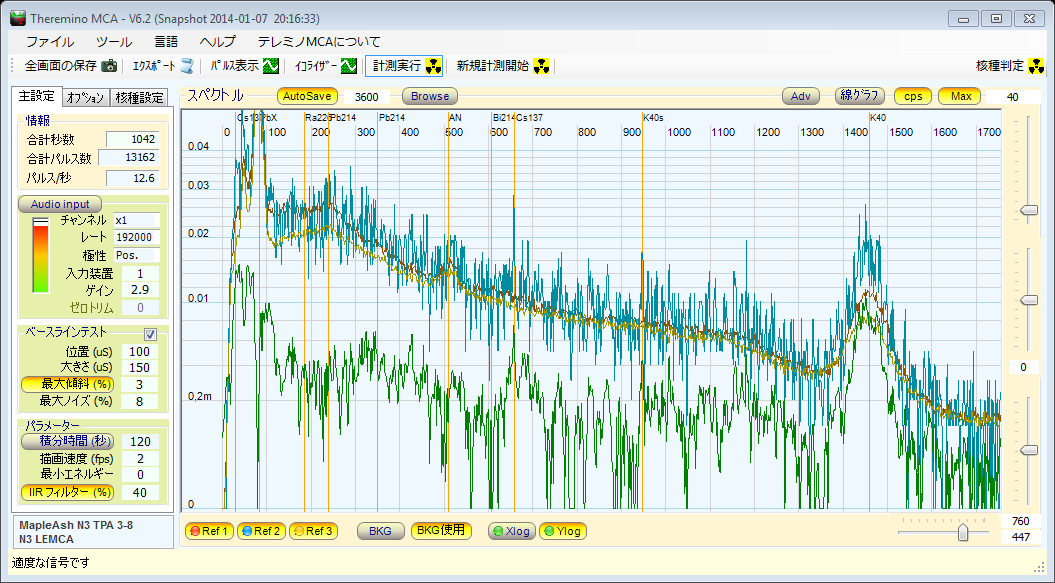
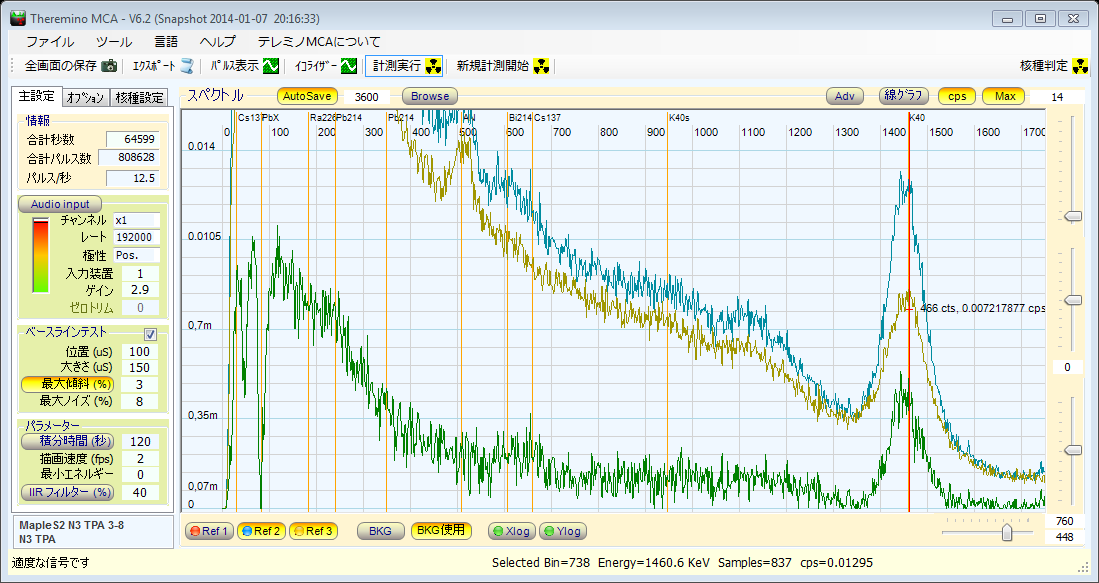
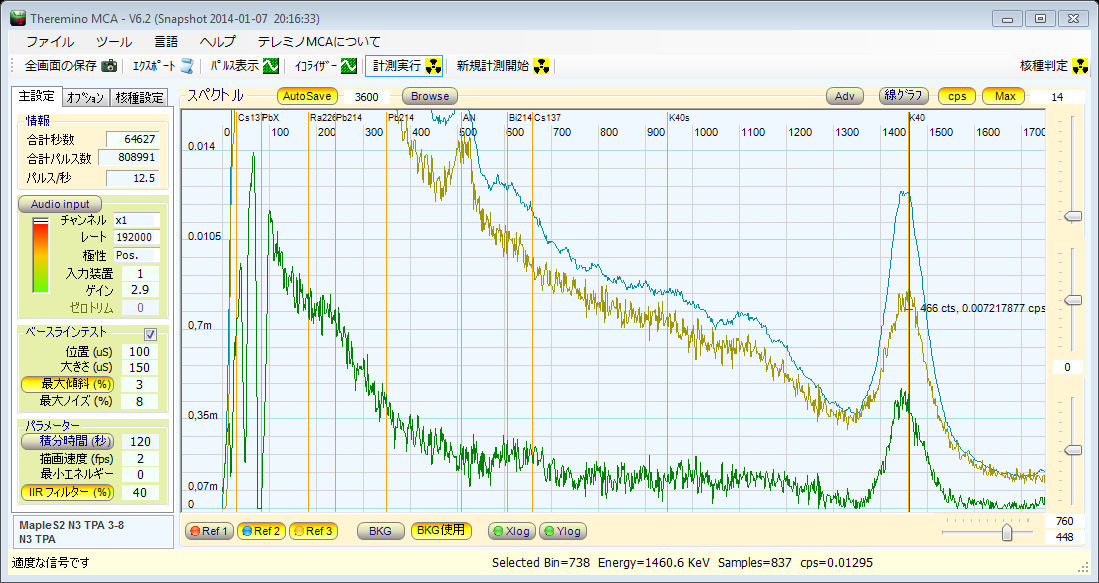
40%のスムージングを入れると、こんな感じ。
With 40% IIR Filter smoothing.
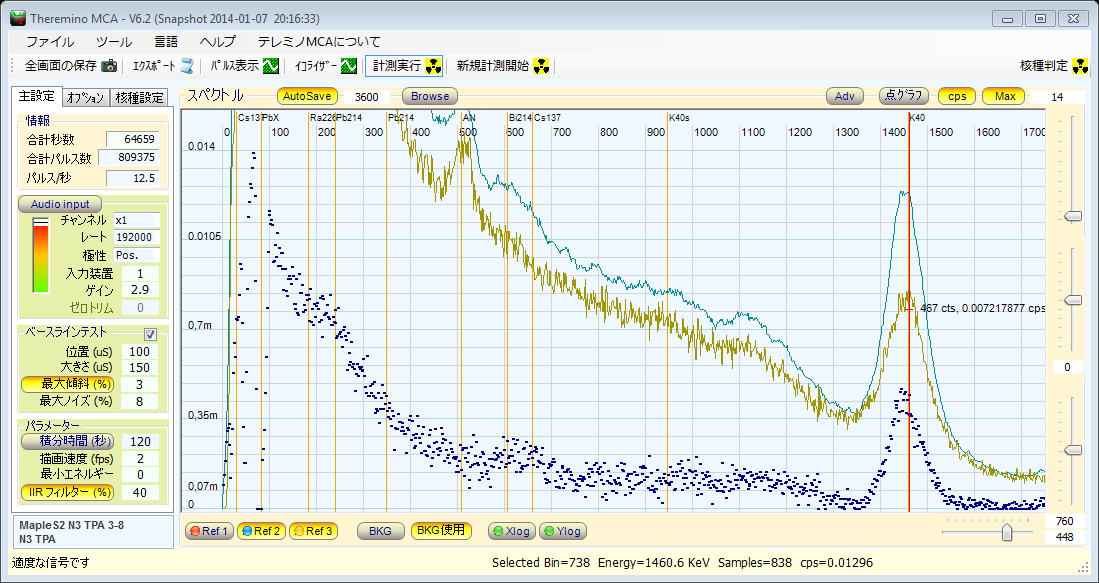
点表示。
The same spectrum with dot graph.
K40の山から、低いほうまでの全体像。
The whole spectrum up to K40 peak.
前回の測定(茶色)との比較。
K40の山の高さなどからすると、詰め方を変えただけで、3割くらい効率が良くなっているみたいです。
これくらいの微妙な汚染だと、3割の違いは、スペクトルの見え方、成長速度などなどに、かなり大きな影響があることが分かります。
また、このことから、横着をしないでメープルシロップをジップロックから別のビニール袋に詰め替えて、
もっと真面目にマリネリ容器に詰め込めば、もしかしたら更に2割くらい効率が良くなるかもしれないと、思いました。
さらには、CsI2.5インチで測った後、200g近くのメープルシロップをこぼしてしまっているので、
総合的に見ると、やっぱりこのNaI3インチの方が、CsI2.5インチよりも理屈通り効率が良いのかもしれません。
Comparing against the previous result (the red line).
Judging from the K40 peak and other indications, the efficiency seems to be about 30% better with improved geometry.
As it wasn't yet optimal way of putting the maple syrup (within a big zip lock bag) into the Marinelli beaker, I'm guessing I can get roughly 20% better efficiency with ideal geometry.
CsI2.5インチでの同じメープルシロップの測定。
The psectrum obtained using 2.5 inch CsI probe.
Sirouto Sokutei Course 、 Basics Of Measurement 、 Quick And Easy 、 Spectrum Formation 、 Giza Giza 、 Visual Peak Detection のページも合わせてご覧下さい。
日本語ページインデックス や 掲示板 には、他の情報も沢山あります。