メープルシロップのスペクトル Maple Syrup spectrums
カナダとアメリカのメープルシロップやメープルシュガーの放射能については、大抵微量のセシウム137が含まれていることが知られており(1Bq/kg 程度の場合が多い)、測定器のテストにも丁度良いので測ってみました。この汚染は、セシウム137だけが検出されることから、チェルノブイリの事故によるものではないかと思われます。その他の可能性としては、Vermont州他の原発の垂れ流し汚染や原爆実験の影響が考えられないこともありませんが、ソ連の事故の影響が日本を含め世界中に見られることから、その可能性の方が高い様に思われます。
As Canadian (and American) Maple syrup and Maple sugar are known to contain small amount of Cs137 (probably from Chernobyl accident fall out. Usually about 1 Bq/Kg. This is confirmed by several different labs in Japan using HPGe and 3" NaI detectors.), I bought some and measured to test my detectors.
使用した測定器は、 Sovtube Detector のCsI2.5インチです。厚さ約8センチの鉛の遮蔽の中で、地元のIGAというスーパーで
クリスマス用に$7.99で安売りしていた「Les Sucrerie Beaurivage」という会社のメープルシロップを2缶弱(一缶あたり540ml)使い、
自家製マリネリに入れて測定しました。(総重量1318g マリネリが138gなので、メープルシロップは1180g)
I used Sovtube Detector CsI 2.5 inch type inside the 3 inch thick lead castle.
I bought the maple syrup at local super market "IGA". It's made by "Les Sucreries Beaurivage"
and each can ($7.99, special price) contains 540ml/18 oz. I put about 2 cans of them in my home made Marinelli Beaker.
幾つかの測定所で行われたメールぷシロップの測定結果については、 Canadian Info のページにリンクがありますので、ご覧ください。
If you are interested in the results of measurements done by several labs in Japan, please follow the links in Canadian Info .
測定の結果 The result
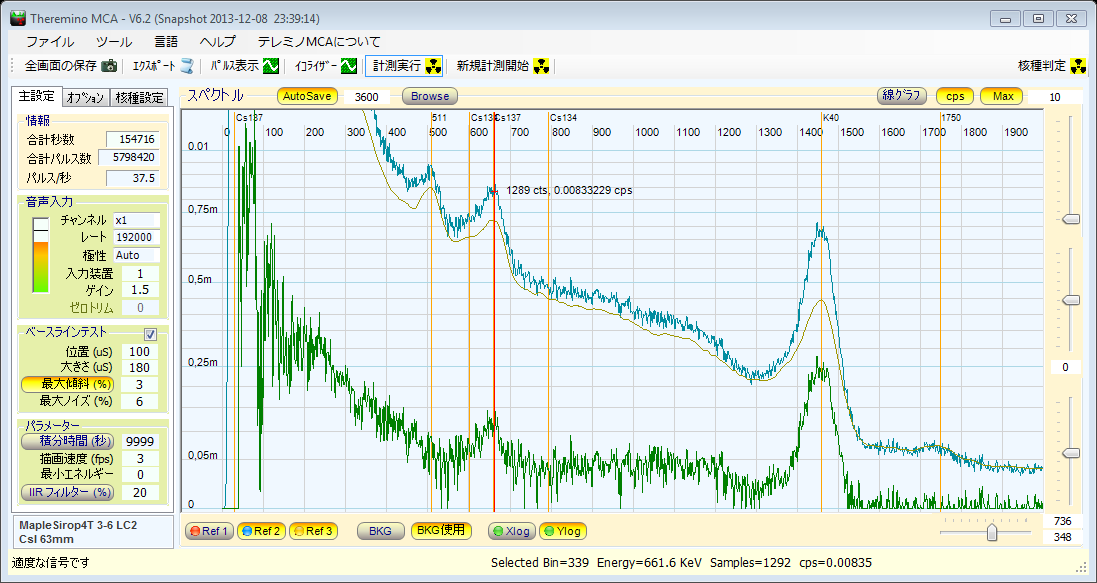
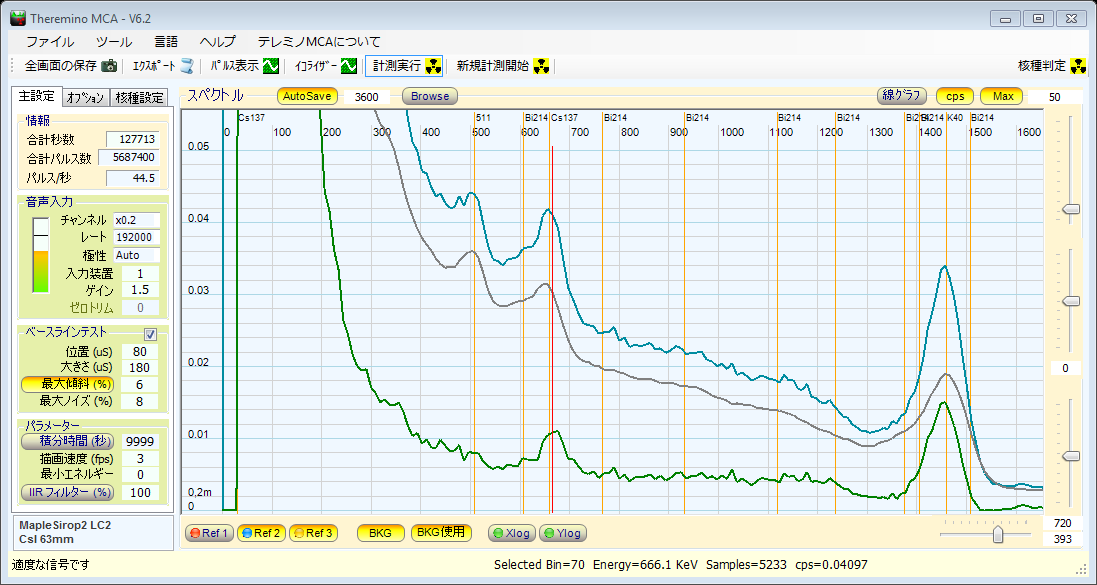
で、これが、48時間の測定の結果です。 水色がメープルシロップのスペクトル。黄色がバックグラウンド。緑がBGを差し引いた差分です。
スムージングとか、フィルターは、かけてません。エネルギー位置は、リニアライザーで少し修正してあります。
BG差分の緑のスペクトルを見ると、セシウム137のピークがあることがわかります。またカリウム40も含まれて居て、
セシウム137のピークは、K40のコンプトン散乱の丘の上に乗っています。
Here is the result after 48 hours. No smoothing/filter is used.
Blue line is the spectrum of maple syrup. Yellow line is the background and the green line is the spectrum after subtracting the BG.
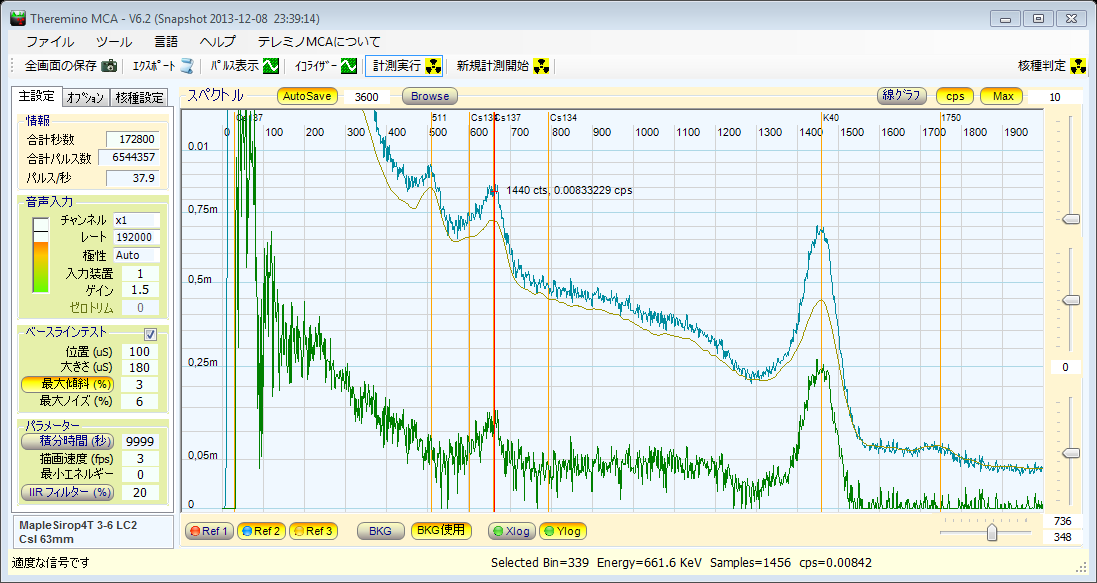
緑のバックグラウンドを差し引いたスペクトルをご覧いただくと、メープルシロップには、背景よりも多くのK40が含まれていることが分かります。
また、このK40のコンプトンエッジとコンプトン散乱の丘が、典型的なわずかな凹みとともにご覧いただけるかと思います。
そして、その少しへこんだところに、小さいながら、Cs137のピークが背景の測定器の自己汚染よりも多く現れているのが
お分かり頂けるかと思います。
このCs137の小山は、コンプトン散乱の上に縦の一目盛り分よりもちょっと多いくらい持ち上がっており、大雑把に、0.0006cps程度の高さでしょう。
As we can see from the green line (BG subtracted), Maple syrup contains more K40 than the background.
This K40 presence creates typical Compton edge and plateau, as well. And from that plateau, small but definite
peak of Cs137 is rising (higher than the peak from self-contamination in BG).
The height of the peak above Compton plateau seems to be about 0.0006cps, a bit more than one ruler division span.
測定器と遮蔽に付いて About the detector and the lead castle
この測定器は、アマチュア用としては、非常に感度が高く、市民測定所でよく使われているAT1320Aと同じ大きさの結晶を使用していますが、
それにも関わらず値段は定価でも12万円くらいで、オークションに出た場合などはその半分以下の価格で購入することも出来ました。
ただし、バックグラウンドのスペクトルをご覧になると分かるように、測定器自身(恐らくCsIの結晶自体)がごく微量のセシウム137で
汚染されており、製造販売元で2013年の12月現在このような問題が再発しない為の検査体制を整備中だそうです。
(詳しくは、 Detector Contamination Case や、 Sovtube Detector のページをご覧ください)
この、わずかとはいえ、自己汚染のある、数万円のアマチュア用測定器を使い、重さ約11kgの再生鉛のインゴットを20個使用した
遮蔽(約10万円)と組み合わせ、合計で20万円にも満たない金額で構築した測定環境でもって、大抵は1Bq/kg程度の汚染と言われる
メープルシロップのセシウム137を検出できるのか?というのが、テストの目的でした。
始めは、自己汚染もあるし、ちょっと無理なんじゃないかな?とか、かなり懐疑的だったのですが、二度、三度と測定を繰り返し、
別の測定器(感度は劣るけど、自己汚染の無いNaIの1.5インチ)を使ったりして測っても、同じ結果が得られることから、
この測定器でも総線量で1ベクレルか2ベクレル程度の汚染を見ることが出来る、という結論になりました。
(汚染の有無が目視で分かる、ということで、「定量できました」とか主張しているのではございません)
The detector I used is very sensitive for an amateur equipment and has the scintillation crystal
of the same size as Atomtex AT1320A (very popular among citizens lab). But the price is a lot less
(about $1200, normally, and can be less than a half of that at eBay, occasionally).
However, unfortunately, I discovered the contamination of the detector itself by Cs137 (probably
it got in the CsI crystal) of varying degree, and the manufacture is now building the lead castle
so that they can weed out contaminated crystal/detector-unit in future.
(Please see Detector Contamination Case , Sovtube Detector for more detail)
The purpose of the test was to find out if we can possibly detect very small amount of Cs137
in the maple syrup (usually about 1 Bq/kg or so), using amateur grade and self-contaminated
detector and the lead castle made of recycled lead ingots.
I first thought it would be tough to see the tiny amount of Cs137. But as I repeated the test,
and as I cross checked using another detector (without self-contamination but with less sensitive
1.5 inch NaI crystal), it became clear that we can indeed see the presence of Cs137.
測定の詳細 The details of measurement
測定開始1時間後。 BGを差し引いたスペクトルです。既に、K40に山があるのは、見て取れます。
An hour after starting the measurement (BG subtracted) . K40 peak can be seen, already.

2時間後。 カリウム40の山は、既に白く抜けています。
After 2 hours. The peak of K40 is blanked out, indicating that the line is definitely above the BG.

3時間後。 BGを差し引く前のスペクトルとバックグラウンドも表示してみました。この時点で、セシウム137に山が出来てくるのが予想できます。
BGと、メープルシロップの線の差が、はっきりしてきているし、BGを差し引いたスペクトル(緑の線)でも、Cs137の領域が白く抜け始めています。
従って、存在の有無の「予想」だけで良いなら、この時点で測定を止めてしまっても構わないでしょう。
After 3 hours. Showing the spectrum of maple syrup before subtracting BG, and the spectrum of BG, as well.
At this moment, we can safely expect the presence of the peak at Cs137 energy position
since the difference between BG and Maple syrup is becoming more distinct and the BG subtracted spectrum
is starting to show the blanked out area at Cs137 region.
If only "the expectation" of the presence of Cs137 is enough, I could have stopped the measurement at this moment.
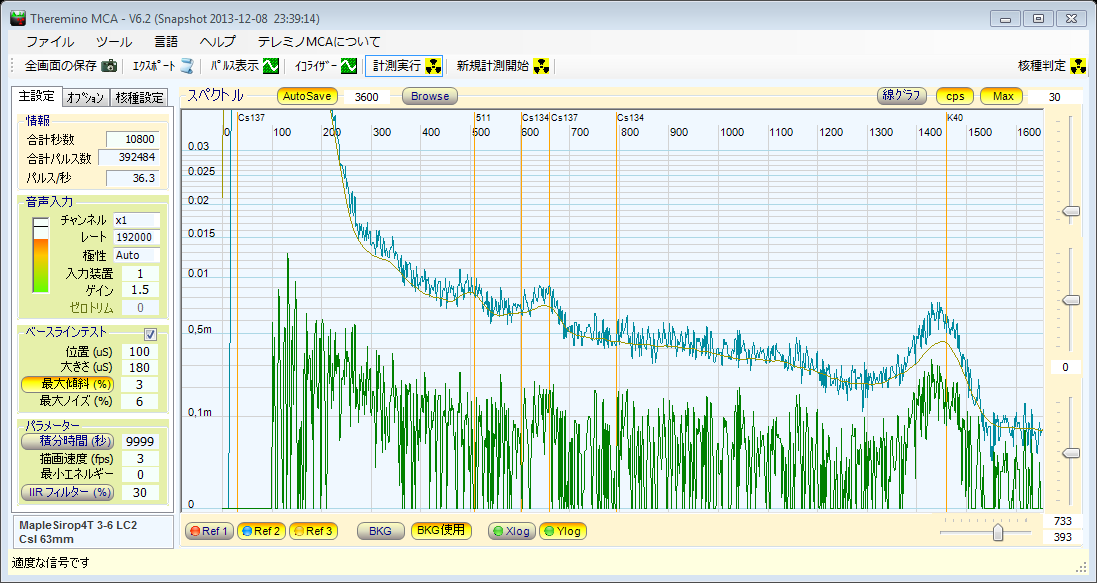
6時間後。 セシウムの山は、確実性が高まっていて、「バラツキ」の可能性の範囲から、出ています。
なので、はっきりとした「存在」だけが知りたいのであれば、この時点で測定を止めてしまっても構わないでしょう。
After 6 hours. The peak for Cs137 is clearly more than the possibility of margin of error.
I could have stopped it, here, if I only wanted to know the definite presence of Cs137.
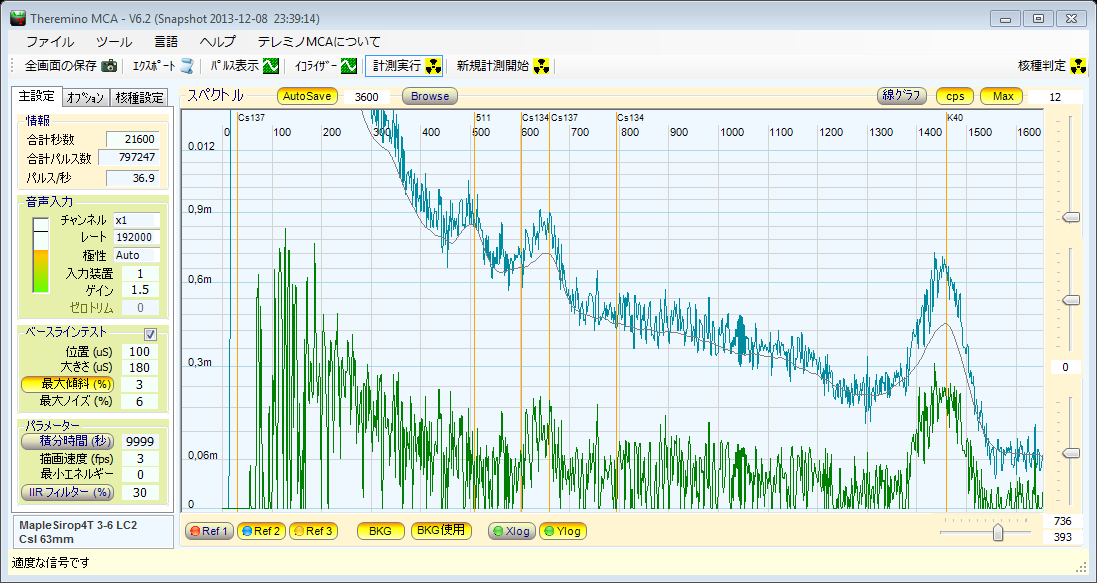
18時間後。 スペクトルのギザギザの幅も収まってきて、測定の信頼性が高まり、誤差が少なくなってきたことが分かります。
また、K40やCs137の領域だけでなく、コンプトン散乱の丘の部分も、差分スペクトルの緑の線が、画面の下から離れてきています。
ただ、セシウムの位置でのチャンネルあたりのカウント数は、まだ500程度ですので、線が滑らかになるまで待つとすると、
かなりの時間(日数)がかかるであろう事が分かります。
After 18hours. The zigzag of the spectrum is now less important and thus the measurement is more reliable with less margin of error.
Not just the regions for K40 and Cs137 but the Compton plateau is getting clear of the bottom of the screen.
However, the pulse counts for the channel around Cs137 are about 500 and it would take more time (days)
if I wanted to wait to see very smooth spectrum.
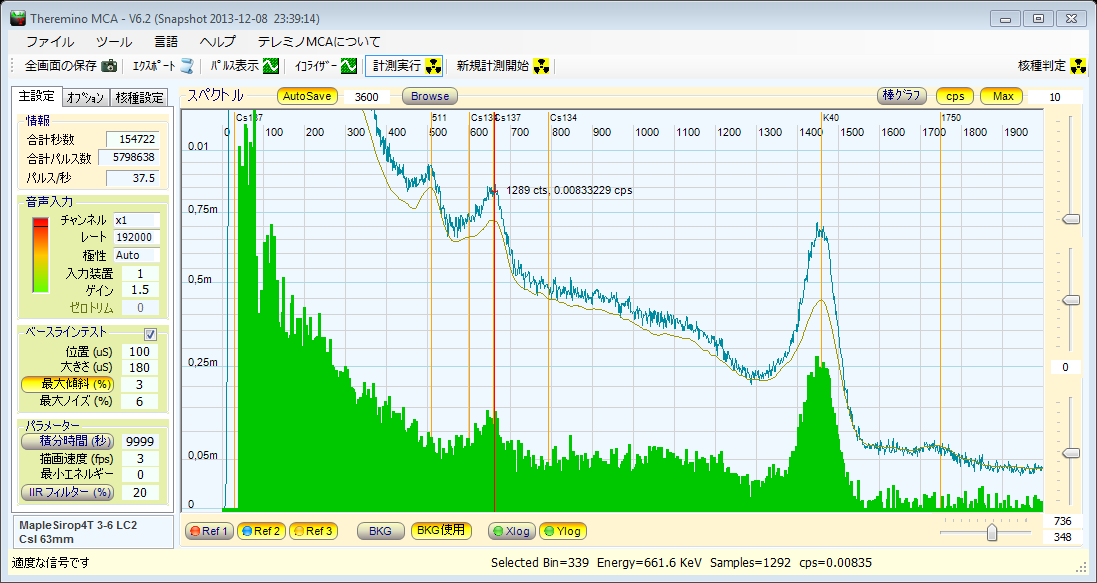
約43時間後。 スペクトルの見え方の違いなどの例として、縦のズームを変えたり、棒グラフや点グラフでも表示してみました。
After more or less 43 hours. To show the effect of zoom and different graphs, I made a few versions of the same spectrum.

別のチャンネル倍率での再測定 Another measurement with different channel pitch
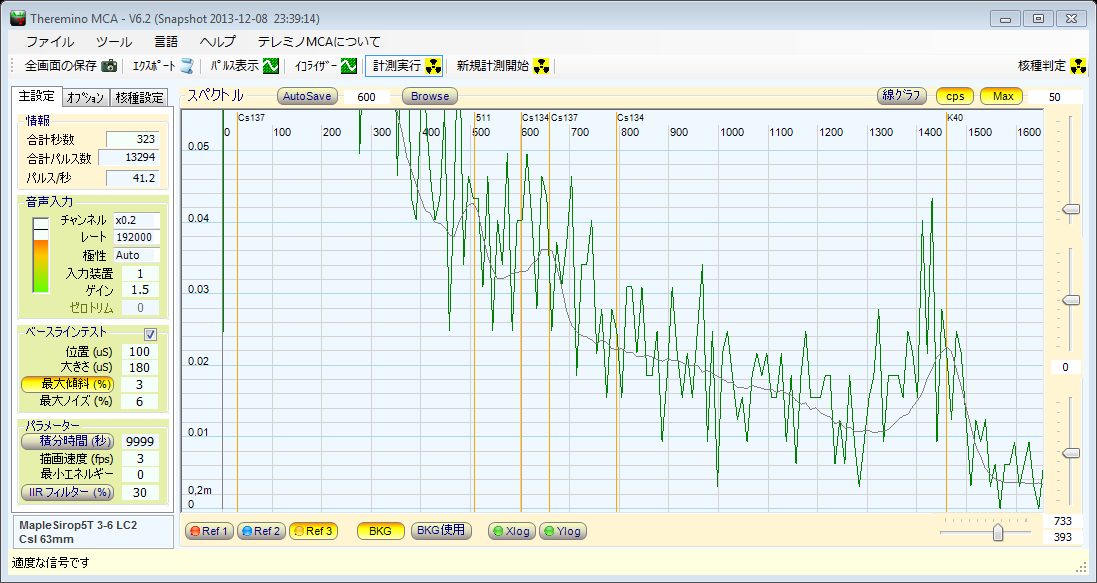
チャンネル倍率の違いによる影響/効果を調べる為に、x0.2の倍率で再測定してみました。 測定開始5分後です。
To see the effect of different channel pitch, I measured again with x0.2 for the Bins parameter.
It's about 5 minutes into the measurement.
2時間後 After two hours
K40がBGよりも高いのは、もう確かだと言っても良いでしょう。Cs137は、BGよりも少し高いようにも見えるけど、まだまだどうなるか分からない、という感じ。
K40 peak at 1460keV seems to be definitely higher than that of BG, while the small peak at Cs137 might be slightly higher than BG but not very sure at all.

3時間後 After 3 hours
先ほどのとあんまり変わりません。BGを差し引いたスペクトルも出してみました。
Not very different from the one before.
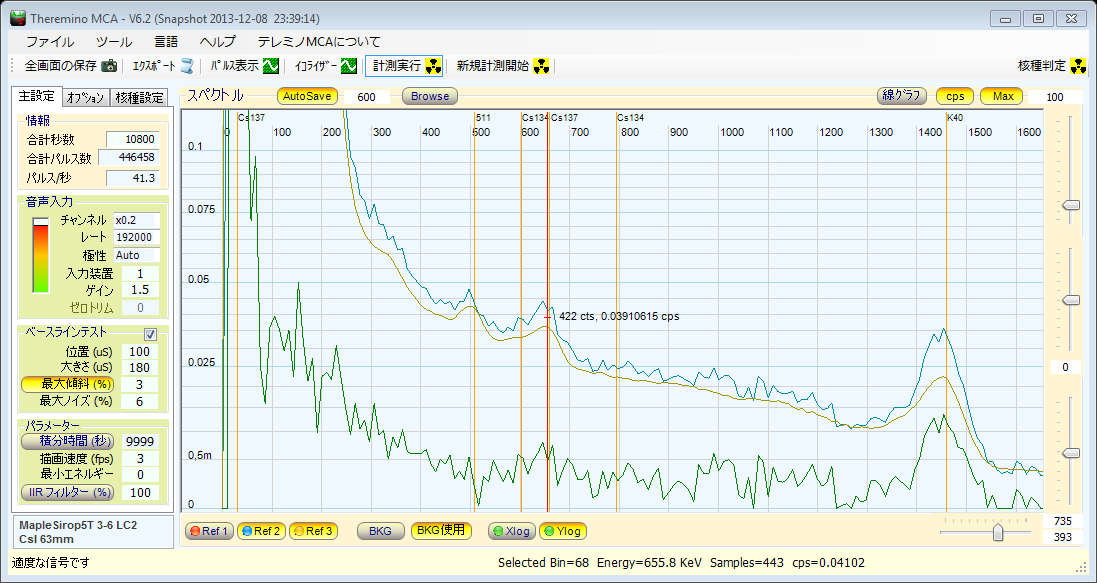
5時間20分後 After 5 hours and 20 minutes
2時間後や3時間後のスペクトルと、それ程変わりませんが、逆に言うと、傾向が安定している、とも思えます。
K40の存在は、ピーク自体と、コンプトン散乱で、もう疑う余地はないでしょう。
Cs137は、コンプトン散乱の丘の部分を平均した高さよりも高いですし、それに、既に40時間以上計測した結果や、
これまで何度が行った結果も知って居るのもあって、まあ、このまま山になるのだろう、と予想できます。
今回が初めての計測だったら、まだまだ慎重に測定を続けるだろうと思います。
で、x1と比べた場合、滑らかになるのは早いのは、確かです。
ただ、ギザギザを逆手にとって、白く抜けるかどうか?というのを、BGよりも(ギザギザという誤差の範囲を超えて)高くなって、
確実に山になるかどうかという判断に使うのは、x1よりも難しいと思いました。
また、x1でスムージング(IIRフィルター)を色々な割合でかけたり外したりして、平行して行ったx0.2の結果と見比べると、
設定にもよりますが、50から60%でフィルターをかけるのとかなり似ていたので、フィルターなしの「完全な生スペクトル」
でもって、つやつや滑らかなスペクトルを早く取りたいのでないなら、x1で、フィルターをかけたり外したりしながら
観察したほうが、総合的な情報量が多いので、素早くスペクトル形勢の兆候を判断するには、若干有利かな?と、思いました。
ただ、どちらのチャンネル倍率であっても、微妙な汚染を検出しようとすると、時間がかかることになりますし、
そうすると、それに見合ったBGも欲しいですし、そのBGと検体の測定をする間の温度やら何やらの管理も大変なので、
十分に練習して、慎重に測定する癖を付け、さらには、確かでない場合には、再測定をしたり、もっと工夫したり、
他の機械でクロスチェックしたり、自分で測らず測定所やプロに頼んだり、「自分の思い込み」に固執せずに
確認を繰り返した方が良いだろうとも思います。
そういう意味では、何にも出ないと分かっている検体で繰り返し測ってみたり、ほんの少しだけ出ると分かっている
検体で練習したり、同じものでも、出だしの様子がちょっと違う場合があったり、勘違いしやすいヒゲや割れ目が
出ることがあったり、というのを何度も見ると、勘違いをしてしまう可能性を減らせるでしょう。
It's not so different from the spectrum of 2 hours later and 3 hours later.
Compared to the measurement using x1 Bin multiplier setting, the spectrum get smoother (without using IIR Filter) quicker.
However, for determining the presence of a peak higher than BG, x0.2 channel pitch offers less information as it's more difficult to see the blank out area, which assert the spectrum of the portion is definitely higher than the BG.
And I found the result of smoothing (at 50 to 60% IIR Filter) pretty similar to the spectrum measured with x0.2 Bin multiplier setting.
So, I guess we can use x1 setting unless it's somehow important to obtain very smooth raw spectrum without any smoothing in shortest duration of time.
Either way, it's tough to detect very small amount of contamination, and it's better to be very cautious about the result, doing recheck, cross check with other detectors, asking third party to check it, in case of uncertainty rather than determining to find (or miss) the presence/absence.
In this case, I've measured the same maple syrup using 3 different detectors, repeatedly and obtained similar results all the time.
And the result is consistent with the measurement done by several different labs on Canadian and American maple syrup.
So, I feel confident (at least for now) about the out come of my experiment with this particular maple syrup.

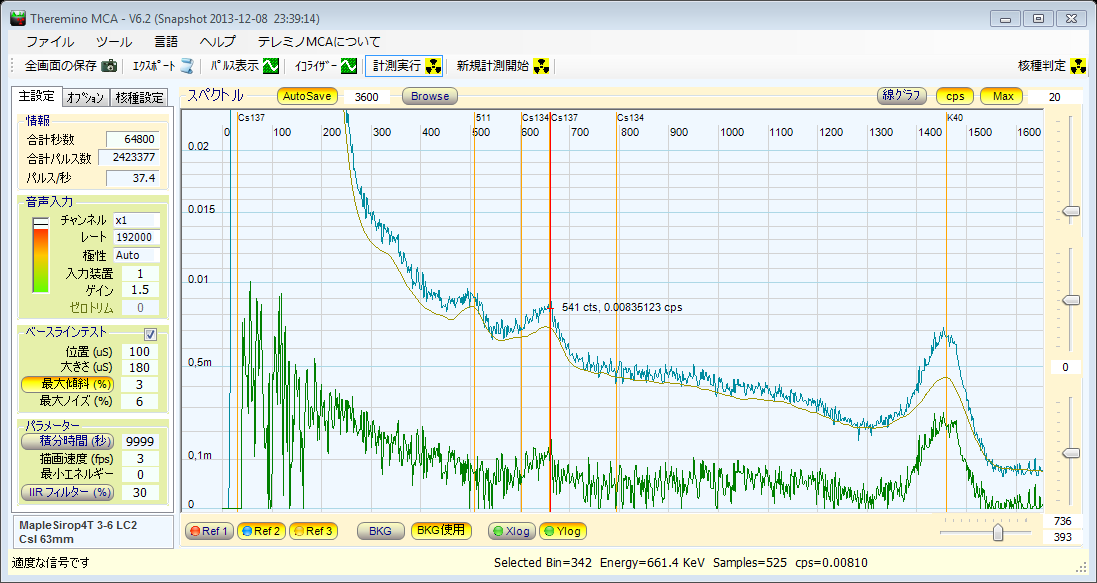
前回の測定 The result of previous measurement
同じCsIの2.5インチの測定器を使ったものです。縦のズームが倍になっているので、印象が違うかもしれませんが、似た結果になっています。 約35時間半の測定。
水色がメープルシロップのスペクトル。黄色や灰色はバックグラウンド。緑がBGを差し引いたスペクトルです。
Using the same CsI 2.5 inch detector. The zoom on Y axis is different, giving slightly different impression, but the result is pretty similar. I measured for about 35.5 hours.
As usual, blue line is the spectrum before BG subtraction, gray (or yellow) is BG, and the green line is after BG subtraction.
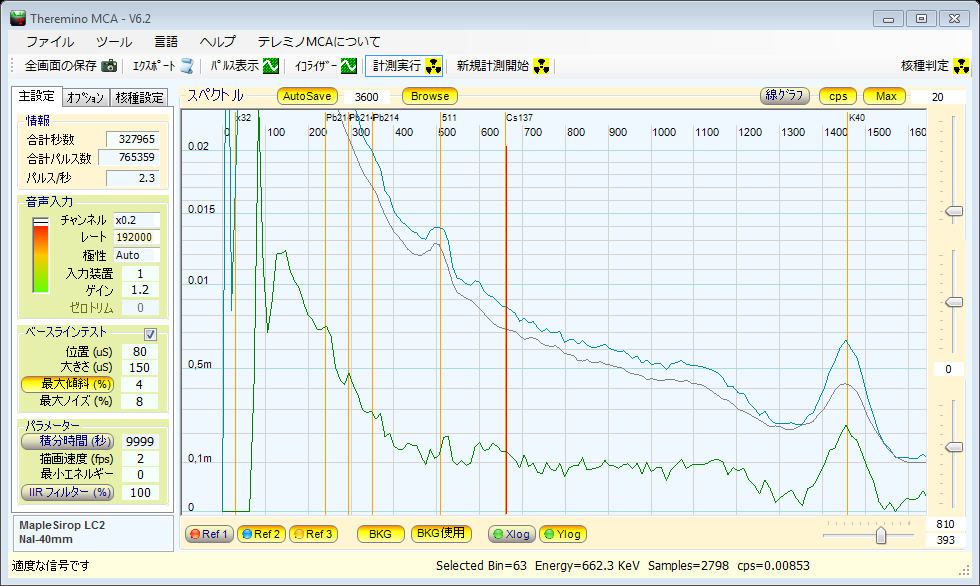
NaIの1.5インチを使った測定の結果 The result of measurement using 1.5 inch NaI detector
1.5インチで感度が低いので、91時間以上測ってみました。これは、確か、今のところ私の最長測定記録。
それでも、2.5インチの時ほど、分かりやすい結果にはならなかったです。
As it's less sensitive, I measured for more than 91 hours. I think it's the longest time I've done.
Still, the result is far less conclusive compared to that of 2.5 inch detector.
灰化したメープルシロップの測定 Measuring ashed down maple syrup
まず。こちらに、低エネルギーガンマ線用の検出器を使って行った、メープルシロップの灰(そして、汚染土壌)の実験がありますので、よろしければご覧ください。
Detecting Contamination With Leg Probe
First, I've used LEG (Low Energy Gamma) probe, RAP-47, to measure the ash from maple syrup (as well as contaminated soil).
Please see this page if you are interested.
Detecting Contamination With Leg Probe
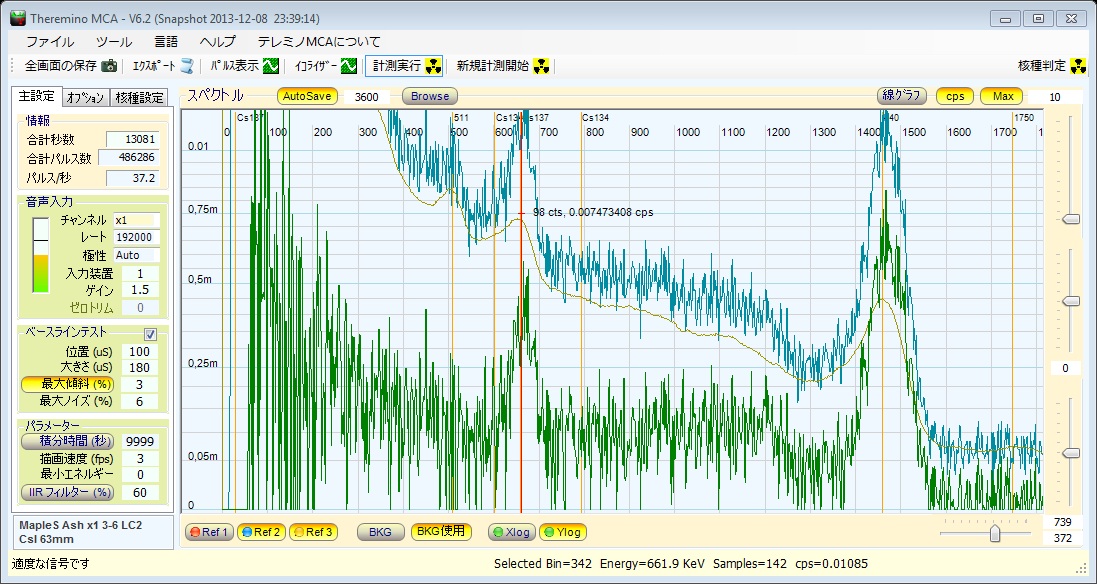
12gのメープルシロップの灰 12g of ash from maple syrup
灰化したメープルシロップは、測定開始から3時間40分くらいで、こんな感じになりました。
長時間測定も、少し疲れたし、もう結果も十分明らかだと思うので、この辺で測定を打ち切ります。
灰化して、元は1.5リットルのメープルシロップが12gに濃縮されてます。
多分、その12gの中に1.5ベクレル+−300% (0.5ベクレルから4.5ベクレルの間?)くらいのセシウム137があるのでしょう。
約1リットルの灰化前のものを測るより、約50%おおい量のセシウムが含まれている筈なので、
それがさらに濃縮されて測定器の結晶にぴったりくっついた位置にあるのも手伝い
検出するのも簡単ですし、そのピークはギザギザの高さを完全に上回っていて
しかもきれいに釣鐘状に持ち上がっているので、「疑いようもなく、明らか」と断言してよいかと思います。
で、同時に、メープルシロップにCs137が含まれていて、灰化前の測定でもそれが検出されていた、
ということの傍証、確認にもなりました。
(一部に、遮蔽の外の線源を検出していたのだろう、とか言い出す人も若干一名いらっしゃいました。)
水色がバックグラウンドを差し引く前のスペクトル。黄色が遮蔽内のバックグラウンド。緑がバックグラウンドを差し引いたスペクトルです。
These are about 3 hours and 40 minutes into the measurement.
I think this is quite enough to say that there is Cs137 (and K40) presence in this ash.
I used 3 cans of 540ml, and thus there should be about 50% more Cs137 compared the measurement done with 1L marinelli beaker.
And it was definitely a lot easier (and quicker) to detect Cs137 due to increased total amount of Cs137 and also due to the fact that all Cs137 is placed closer to the detector.
Making ash helps to identify, but it took very very long time that I wouldn't do it so often.
The blue line is the spectrum of the ash. Yellow is the background (inside lead castle). The green line is after BG subtraction.
The background is measured for 60 + hours. It's not smoothed in two spectrum using x1 channel pitch.
The background was imported and integrated and interpolated for the last spectrum with x0.2 channel pitch.
まずは、x1の細かなチャンネル倍率でスムージング無し。
Fisrt, the spectrum with x1 Bin multiplier setting and without any smoothing.
http://pico.dreamhosters.com/img/V60/2013_12_16_17_02_06-MapleS_Ash_x1_3-6_LC2-CsI_63mm.spe
http://pico.dreamhosters.com/img/V60/2013_12_16_17_02_06-MapleS_Ash_x1_3-6_LC2-CsI_63mm.txt
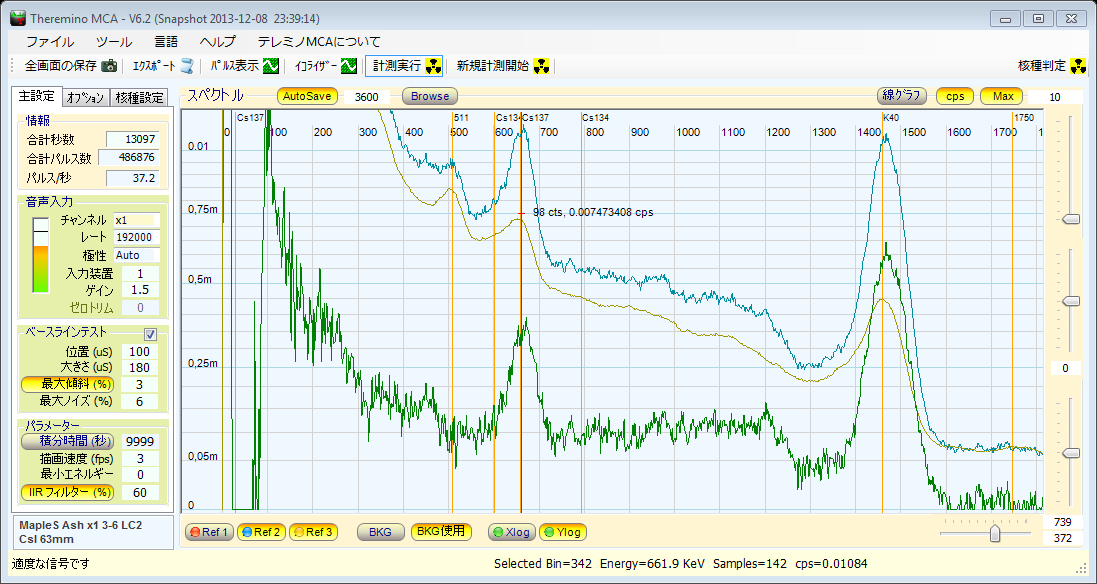
上の、x1のチャンネル倍率のものに、60%のIIRフィルターをかけたもの。
Then, this one is the same as above but with smoothing of 60% IIR Filter setting.
http://pico.dreamhosters.com/img/V60/2013_12_16_17_02_23-MapleS_Ash_x1_3-6_LC2-CsI_63mm.spe
http://pico.dreamhosters.com/img/V60/2013_12_16_17_02_23-MapleS_Ash_x1_3-6_LC2-CsI_63mm.txt
そして、x0.2の粗いチャンネル倍率のもの。 二つ目のテレミノMCAを同時に走られてとったスペクトルです。
Finally, the spectrum using x0.2 Bin multiplier setting. I ran second ThereminoMCA for this.
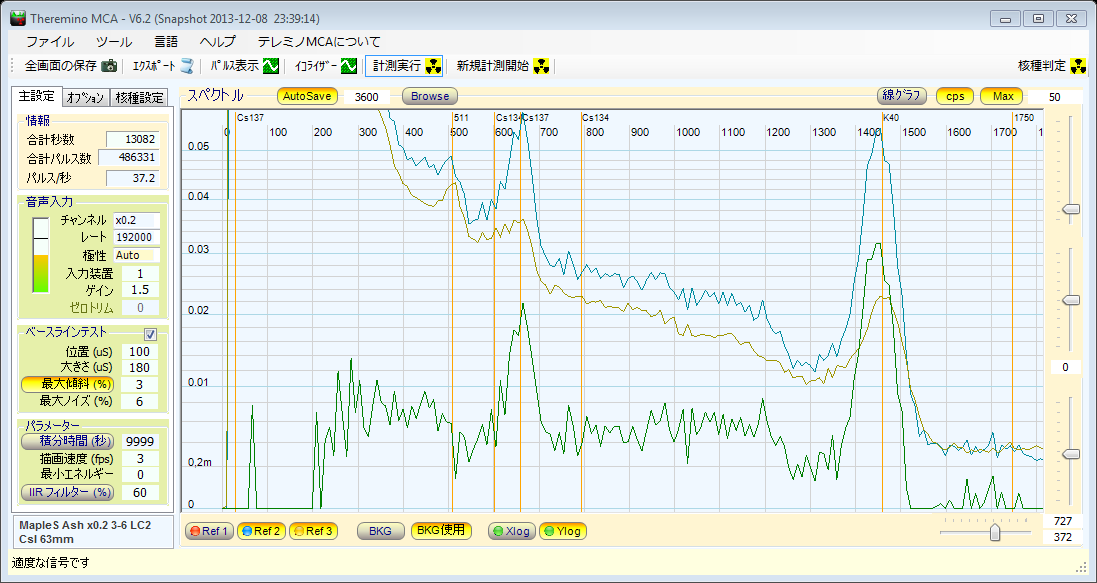
http://pico.dreamhosters.com/img/V60/2013_12_16_17_03_03-MapleS_Ash_x0.2_3-6_LC2-CsI_63mm.spe
http://pico.dreamhosters.com/img/V60/2013_12_16_17_03_03-MapleS_Ash_x0.2_3-6_LC2-CsI_63mm.txt
Yet another measurements
3インチNaIプローブのテストの一環として、再度メープルシロップを測って見ました。
I measured the maple syrup for testing new 3 inch NaI probe.
Sirouto Sokutei Course 、 Basics Of Measurement 、 Quick And Easy 、 Spectrum Formation 、 Giza Giza 、 Visual Peak Detection のページも合わせてご覧下さい。
日本語ページインデックス や 掲示板 には、他の情報も沢山あります。