福島第一原発事故当時の3Dスペクトル 3D Spectrum of Fukushima Disaster
Gnuplotを使って、福島県より公開されている事故当時のスペクトルデータから、
3Dスペクトルを作成してみました。
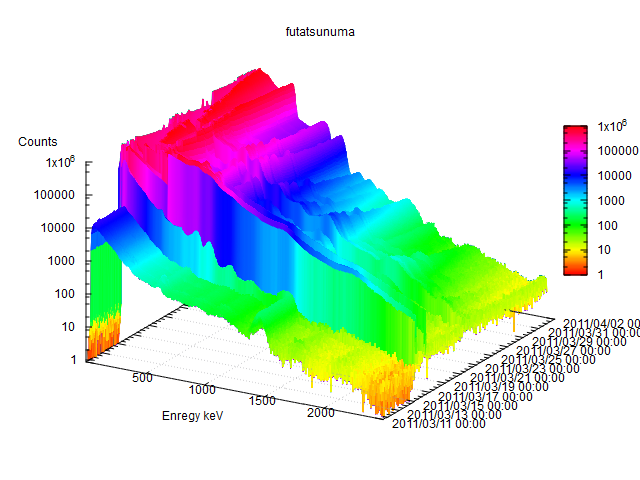
Using (almost pure) shellscript and Gnuplot, I made 3D gamma spectrum that shows the evolution of the nuclear disaster at Fukushima Daiichi power plant.
公開されている原発周辺のモニタリングポストのスペクトルデータは、10分値のものが5地点、
一時間値のものが11箇所あります(その内3箇所は、10分値の地点と同じ)。
There are 5 monitoring posts that sent spectrum data every ten minutes, and 11 posts sent data every hour, at the time of the accident. (3 posts sent at both intervals.)
以下は、1時間値の11地点と10分値の2箇所のデータの全体像
(データが保存されていて公開されている全期間で2011年3月11日の零時から
測定器が壊れたりバッテリーが切れたりした?時まで)の3Dグラフです。
それぞれのグラフが表示している期間の長さが同じでは無い点にご留意下さい。
Following graphs show the data from 11 posts with 10 minutes interval, and 2 posts with 1 hour interval, from 2011-03-11 until post quit recording data (probably due to battery life, damage from radiation, etc).
So, please be aware that the time period covered by each graph and the scale (for time) are different.
測定器は、おそらく全て2インチのNaIで、元のデータは、約1000チャンネルのチャンネルデータですが、
おおよそ1チャンネル当たり5keVの割合なので、分かりやすい様にエネルギーで目盛りを出しています。
(ただし、細かい横軸の校正は、測定中にズレたりしているのが、確認されています。)
Spectrometers are said to be of 2" NaI and MCA with 1000 channel covering up to 5MeV.
The channel data is not precisely calibrated (energy wise), but I showed energy in keV for y tics.
それぞれの地点の画像の上のリンクは、Gnuplot用のコマンドスクリプトとデータが一体化された
csvファイルで、これをダウンロードしてGnuplotをインストールすれば、ご自宅のマシンで、
この様な画像を見たり、拡大、縮小したり、表示方法を変更したりすることが出来ます。
(これらのコマンドとデータが一体化されたファイルは、小さいもので2メガバイトくらい、
大きなものは10メガバイトくらいあり、大野局は17メガバイト以上の大きさなので、
遅い回線をご利用の場合はご注意下さい。)
Gnuplotでこれらを表示する際には、出来るだけ高性能のマシンを使った方が快適です。
遅いマシンの場合は、色の表示を止めたり、データを分割しないと表示や3Dグラフの操作に
非常に時間がかかるかもしれません。
Gnuplotでスペクトルをこの様に3D表示する方法などの詳細に付いては、別ページで紹介しています。
The link above each graph is a file that contains combined csv data and Gnuplot command script.
They are roughly 2MB to 10MB but the one for Oono station is about 17MB. Please be aware of the size if your connection is not so fast.
Also, showing these graphs with Gnuplot needs good amount of processor power.
You may want to divide the data-command file or modify it to show only mesh instead of the color.
各地点の位置関係に付いては、以下の地図が、まあまあ参考になります。
福島市の紅葉山のモニタリングポストを以外は、すべて原発の周辺です。
Although in Japanese, the map bellow shows the location of each monitoring posts.
They are all pretty close to the nuclear power plant except Momijiyama station is near Fukushima-city (about 50 or more km away).

向畑局 Mukaihata MP
http://pico.dreamhosters.com/raddata/ja/2011_spector_all/201103_spc06_mukaihata.plt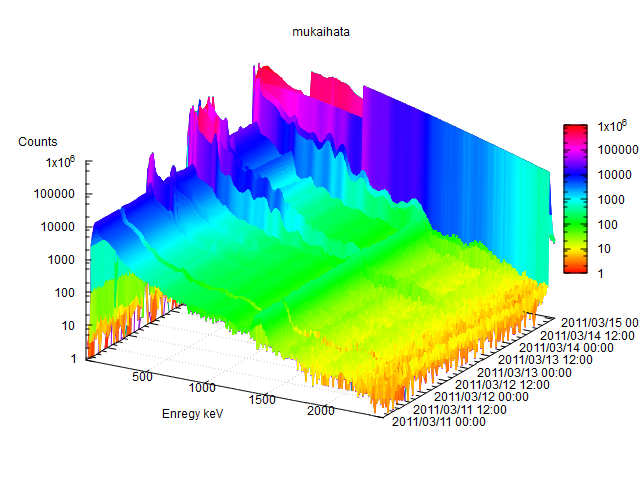
大野局 Oono MP
http://pico.dreamhosters.com/raddata/ja/2011_spector_all/201103_spc07_oono.plt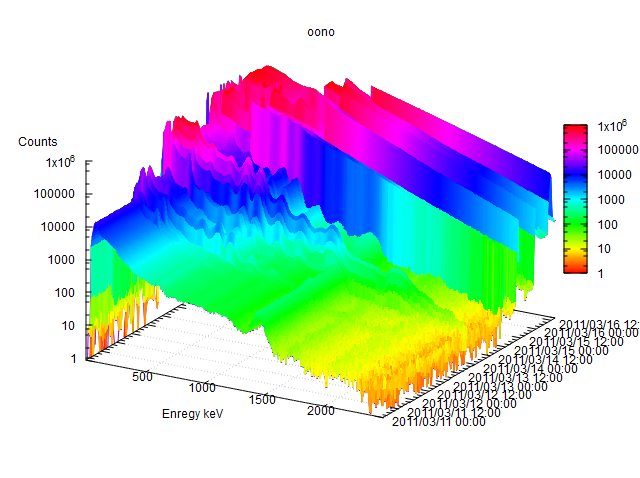
夫沢局 Ottozawa MP
http://pico.dreamhosters.com/raddata/ja/2011_spector_all/201103_spc08_ottozawa.plt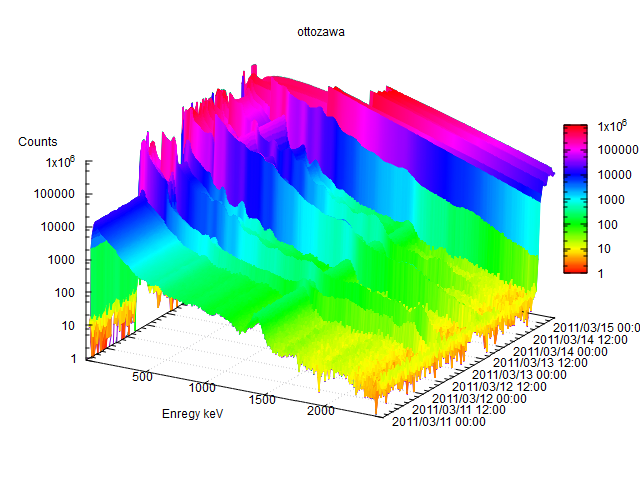
山田局 Yamada MP
http://pico.dreamhosters.com/raddata/ja/2011_spector_all/201103_spc09_yamada.plt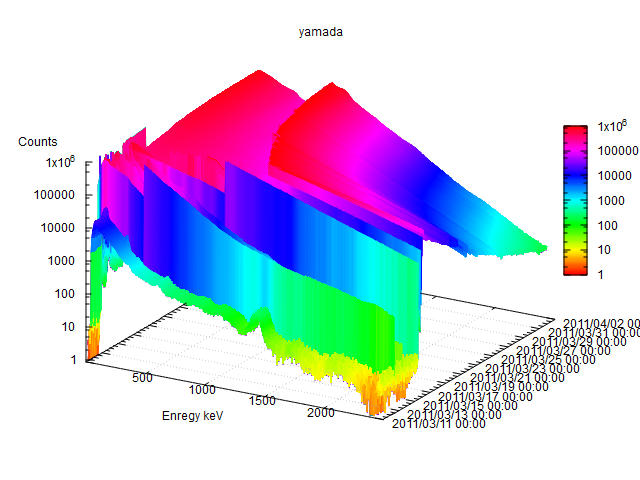
郡山局(原発の直ぐ近くの地点で、郡山市ではありません。念の為) Kooriyama MP
http://pico.dreamhosters.com/raddata/ja/2011_spector_all/201103_spc10_kooriyama.plt
紅葉山局(福島市) Momijiyama MP
http://pico.dreamhosters.com/raddata/ja/2011_spector_all/201103_spc19_momijiyama.plt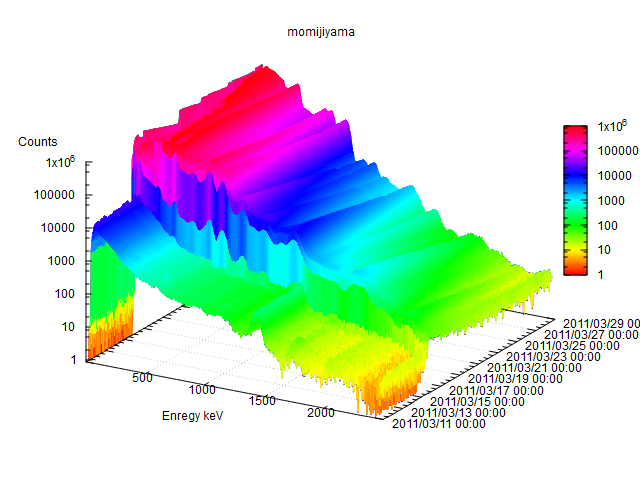
二ツ沼局 Futatsunuma MP
上の福島市の紅葉山と第二原発よりさらに南の二ツ沼を比べると、紅葉山では見られないプルームが南側では何度も通っているのが分かりやすい。
http://pico.dreamhosters.com/raddata/ja/2011_spector_all/201103_spc20_futatsunuma.plt
松館局 Shoukan MP
http://pico.dreamhosters.com/raddata/ja/2011_spector_all/201103_spc21_shoukan.plt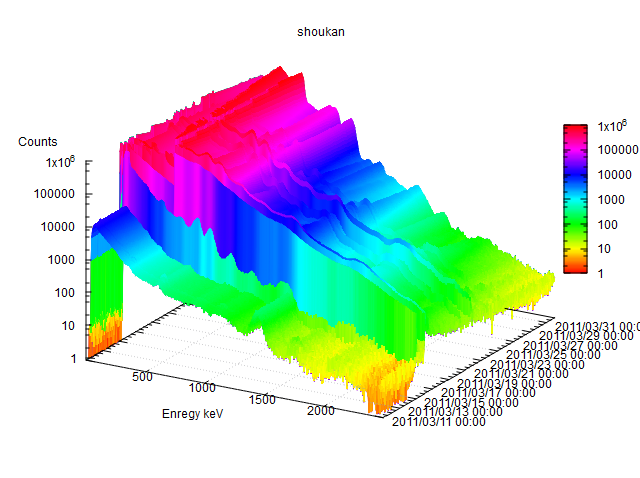
下郡山局 Shimokooriyama MP
http://pico.dreamhosters.com/raddata/ja/2011_spector_all/201103_spc22_shimokoori.plt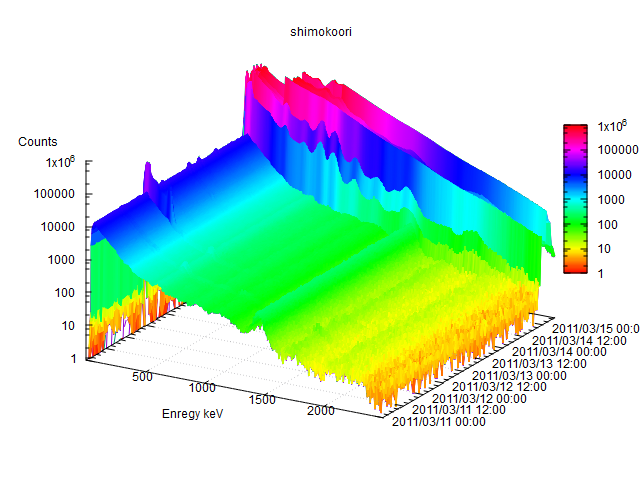
南台局 Minamidai MP
http://pico.dreamhosters.com/raddata/ja/2011_spector_all/201103_spc24_minamidai.plt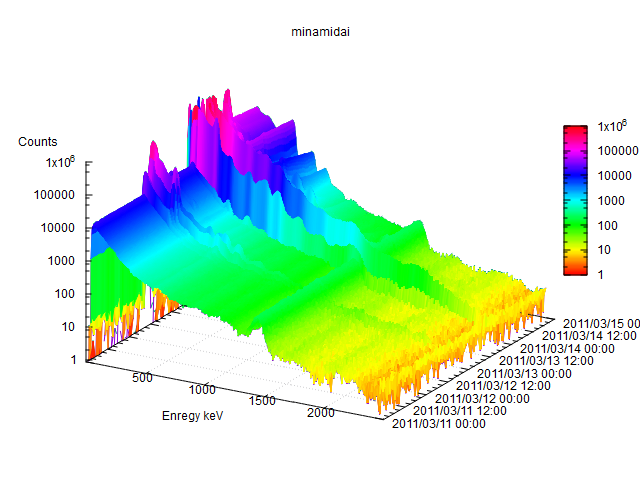
上羽鳥局 Kamihatori MP
http://pico.dreamhosters.com/raddata/ja/2011_spector_all/201103_spc25_kamihatori.plt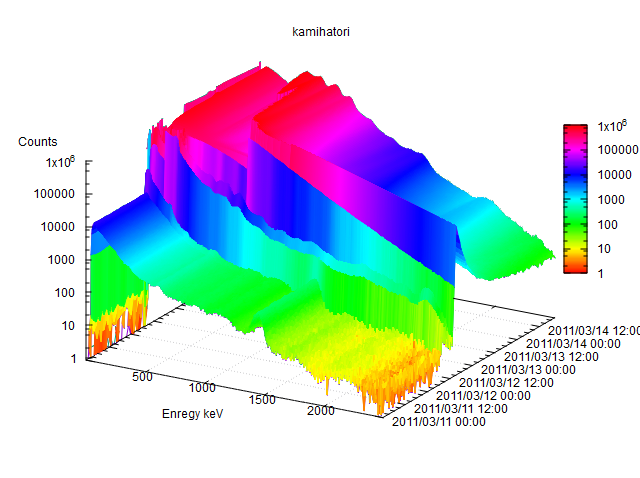
一時間値のデータが提供されていない2地点 2 posts with 10 minutes data interval
富岡局 Tomioka MP
http://pico.dreamhosters.com/raddata/ja/2011_spector_all/201103_spector05_tomioka.plt
繁岡局 Shigeoka MP
http://pico.dreamhosters.com/raddata/ja/2011_spector_all/201103_spector01_shigeoka.plt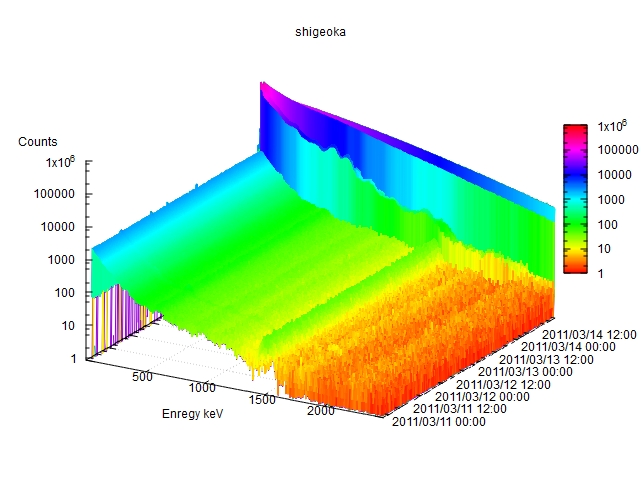
その他の画像やデータ Other graphs and data
このディレクトリー(フォルダー)に全部入っていますので、ご利用下さい。
They are all placed in this directory.
http://pico.dreamhosters.com/raddata/ja/2011_spector_all/
データは福島県が公開しているものです。ページが変更になっていたので、ここにリンクしておきます。
The spectrum data can be found, here.
http://www.atom-moc.pref.fukushima.jp/old/monitoring/monitoring201103/201103_mpdata.html
画像データのビューワー Image viewer
簡易画像ビューワーの使い方 (Javascriptが切ってある場合は、単に画像のリストが表示されます。):
前後の矢印ボタンで次の画像や前の画像に切り替わります。左右のカーソルキーも使える筈ですが、「N」と「P」も使えます。
キープボタン(Keep)か「K」を押すと、その画像をボタンの下にキープし、幾つかの画像を比較し易くなります。
クリアボタン(Clear)か「C」のキーで、キープした画像を一掃出来ます。
リスト表示(List)のボタンか「L」のキーで、画像へのリンクのリストの表示を切り替えられます。
スライドショー(
スライドショーの間隔(秒数)を変えたい時は一度止めて、再スタートしてください。
It uses Javascript and it only shows the links to images if Javascript is off.
You can use left/right cursor keys or P/N keys for previous/next image, as well as the buttons.
Keep button (or K key) will keep the current image below.
Clear button (or C key) will clear away the images kept below.
Slide Show (or S key) will start/stop slide show. To change the interval (pause) between each image, please stop the slide show and restart after modifying the input area.
http://pico.dreamhosters.com/raddata/ja/2011_spector_all/kooriyama-2011-03-12-0500.png
http://pico.dreamhosters.com/raddata/ja/2011_spector_all/kooriyama-2011-03-12-0500b.png
http://pico.dreamhosters.com/raddata/ja/2011_spector_all/kooriyama-2011-03-12-0500c.png
http://pico.dreamhosters.com/raddata/ja/2011_spector_all/kooriyama-test2.png
http://pico.dreamhosters.com/raddata/ja/2011_spector_all/momijiyama-2011-03-11.png
http://pico.dreamhosters.com/raddata/ja/2011_spector_all/momijiyama-2011-03-12.png
http://pico.dreamhosters.com/raddata/ja/2011_spector_all/momijiyama-2011-03-13.png
http://pico.dreamhosters.com/raddata/ja/2011_spector_all/momijiyama-2011-03-14.png
http://pico.dreamhosters.com/raddata/ja/2011_spector_all/momijiyama-2011-03-15.png
http://pico.dreamhosters.com/raddata/ja/2011_spector_all/momijiyama-2011-03-16.png
http://pico.dreamhosters.com/raddata/ja/2011_spector_all/momijiyama-2011-03-17.png
http://pico.dreamhosters.com/raddata/ja/2011_spector_all/momijiyama-2011-03-18.png
http://pico.dreamhosters.com/raddata/ja/2011_spector_all/momijiyama-2011-03-19.png
http://pico.dreamhosters.com/raddata/ja/2011_spector_all/momijiyama-2011-03-20.png
http://pico.dreamhosters.com/raddata/ja/2011_spector_all/momijiyama-2011-03-21.png
http://pico.dreamhosters.com/raddata/ja/2011_spector_all/momijiyama-2011-03-22.png
http://pico.dreamhosters.com/raddata/ja/2011_spector_all/momijiyama-2011-03-23.png
http://pico.dreamhosters.com/raddata/ja/2011_spector_all/momijiyama-2011-03-24.png
http://pico.dreamhosters.com/raddata/ja/2011_spector_all/momijiyama-2011-03-25.png
http://pico.dreamhosters.com/raddata/ja/2011_spector_all/momijiyama-2011-03-26.png
http://pico.dreamhosters.com/raddata/ja/2011_spector_all/momijiyama-2011-03-27.png
http://pico.dreamhosters.com/raddata/ja/2011_spector_all/momijiyama-2011-03-28.png
http://pico.dreamhosters.com/raddata/ja/2011_spector_all/mukaihata-2011-03-12.png
http://pico.dreamhosters.com/raddata/ja/2011_spector_all/mukaihata-2011-03-13.png
http://pico.dreamhosters.com/raddata/ja/2011_spector_all/oono-2011-03-11.png
http://pico.dreamhosters.com/raddata/ja/2011_spector_all/oono-2011-03-12.png
http://pico.dreamhosters.com/raddata/ja/2011_spector_all/oono-2011-03-13-10.png
http://pico.dreamhosters.com/raddata/ja/2011_spector_all/oono-2011-03-13-15.png
http://pico.dreamhosters.com/raddata/ja/2011_spector_all/oono-2011-03-13-17.png
http://pico.dreamhosters.com/raddata/ja/2011_spector_all/oono-2011-03-13.png
http://pico.dreamhosters.com/raddata/ja/2011_spector_all/oono-2011-03-14-22.png
http://pico.dreamhosters.com/raddata/ja/2011_spector_all/oono-2011-03-14.png
http://pico.dreamhosters.com/raddata/ja/2011_spector_all/oono-2011-03-15-10.png
http://pico.dreamhosters.com/raddata/ja/2011_spector_all/oono-2011-03-15.png
http://pico.dreamhosters.com/raddata/ja/2011_spector_all/oono-2011-03-16-01.png
http://pico.dreamhosters.com/raddata/ja/2011_spector_all/oono-2011-03-16-10.png
http://pico.dreamhosters.com/raddata/ja/2011_spector_all/oono-2011-03-16.png
http://pico.dreamhosters.com/raddata/ja/2011_spector_all/ottozawa-2011-03-12-05.png
http://pico.dreamhosters.com/raddata/ja/2011_spector_all/ottozawa-2011-03-13-09.png
http://pico.dreamhosters.com/raddata/ja/2011_spector_all/ottozawa-2011-03-13-14.png
http://pico.dreamhosters.com/raddata/ja/2011_spector_all/ottozawa-2011-03-14-02.png
http://pico.dreamhosters.com/raddata/ja/2011_spector_all/ottozawa-2011-03-14-20.png
http://pico.dreamhosters.com/raddata/ja/2011_spector_all/ottozawa-2011-03-14-21.png
http://pico.dreamhosters.com/raddata/ja/2011_spector_all/shigeoka-2011-03-12-0600.png
http://pico.dreamhosters.com/raddata/ja/2011_spector_all/shigeoka-2011-03-13-1000.png
http://pico.dreamhosters.com/raddata/ja/2011_spector_all/shigeoka-2011-03-14-2200.png
http://pico.dreamhosters.com/raddata/ja/2011_spector_all/tomioka-2011-03-12-0800.png
3Dスペクトルで無く、スペクトルの変化をアニメーションで見たい場合
2014年になって公表された福島の原発事故の当時のデータの改訂版に含まれるスペクトルを、テレミノMCAで読み込めるようにして観察して見ました。大野の10分毎のデータをアニメーション再生して、最初の汚染の到来の様子などを録画してあります。この読み込みに使ったテレミノMCA(改造作業中に付きまだ非公開)とデータのパッケージを欲しい方は、ご連絡ください。
ファイルが大きいのでダウンロードに時間がかかるかも(337MB)
http://pico.dreamhosters.com/img/Misc/Fukushima_playback.zip

2次元の線量の推移だけ見たい場合
この「まとめ」に色々あります。
http://togetter.com/li/377226

福島県が作ったPDF
http://www.pref.fukushima.lg.jp/sec_file/monitoring/etc/post4-20120921.pdf
関連するページ
- 放射線量グラフの読み方 Reading Gamma Radiation Dose Rate
- 放射線量率の変動と温度などとの関係 Radiation Deserate Vs Temperature
- 2014年6月の神奈川県川崎市の浮島局と千鳥局における不思議な線量の推移 Kawasaki Kanagawa Case201406
- 線量よりも車両の往来を測っている福島県双葉郡楢葉町上繁岡地区集会所MPのケース Kamishigeoka Narahamachi Fukushima
- うち(カナダ東部)の背景放射線 Background Radiation Of My Home
- エクセルのデータやマクロとその画像 Excel Data And Macro
- 気象情報関連のページ Weather Data Ja
- 線量のスパイクについて Dose Rate Spikes
- 2013年夏(8月19日)の瓦礫飛散のグラフやマップ Radioactive Dust Of Summer2013
- 2014年夏の線量推移 Dose Rate Graph Of Summer2014
- 今週の線量推移 Dose Rate Graph Of This Week
- Gnuplotの使い方やデータのメモ Gnuplot Memo
- Gnuplotで3Dスペクトルを表示する為のメモ Gnuplot Memo3D
幾つかの地点の線量の推移と気象データ
- 山口県萩市の2014年の線量と気象の推移 Hagi Yamaguchi2014
- 2014年7月にスパイクのあった福島県広野町東下地区集会所 Azumakudari Fukushima
- 2014年7月に線量が(一時的に?)急降下した飯舘村役場 蕨平自治公民館 Warabitaira Fukushima
- 上記の浮島、千鳥、そして川崎の線量と、羽田の気象データを組み合わせたグラフ Ukishima Chidori Tonomachi2014
- 福島第一原発周辺の情報マップ: Fukushima Daiichi Map Of Rad Info
- 福島第一原発周辺(20から30kmくらい)の情報マップ: Fukushima Daiichi Second Map Of Rad Info
- 福島第一原発周辺(30から40kmくらい)の情報マップ: Fukushima Daiichi Third Map Of Rad Info
- 福島第一原発周辺(40から50kmくらい)の情報マップ: Fukushima Daiichi Fourth Map Of Rad Info
- 福島第一原発周辺(50から60kmくらい)の情報マップ: Fukushima Daiichi Fifth Map Of Rad Info
- 鮫川村の情報マップ: Samekawamura Map Of Radinfo
- 川内原発周辺の情報マップ: Satsuma Sendai Map Of Rad Info
- 宇都宮の情報マップ: Utsunomiya Map Of Radinfo
- 埼玉周辺の情報マップ: Saitama Map Of Rad Info
- 松本周辺の情報マップ: Matsumoto Map Of Rad Info
- 新潟周辺の情報マップ: Niigata Map Of Rad Info
- 仙台周辺の情報マップ: Sendai Map Of Rad Info
- 全アメダス、気象台情報マップ: The Map Of Amedas
Radiation Detection / English Documents ... Francais ... 日本語ページインデックス / Survey Links ... 掲示板 / 放射線量 / 線量データ
